Annual Financial Statements 2010 of Bank Austria
Annual Financial Statements 2010 of Bank Austria
Annual Financial Statements 2010 of Bank Austria

Create successful ePaper yourself
Turn your PDF publications into a flip-book with our unique Google optimized e-Paper software.
Consolidated <strong>Financial</strong> <strong>Statements</strong> in accordance with IFRSs<br />
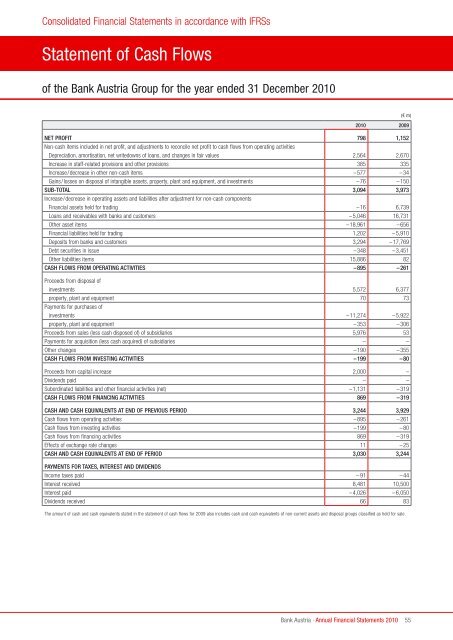
Statement <strong>of</strong> Cash Flows<br />
<strong>of</strong> the <strong>Bank</strong> <strong>Austria</strong> Group for the year ended 31 December <strong>2010</strong><br />
<strong>Bank</strong> <strong>Austria</strong> · <strong>Annual</strong> <strong>Financial</strong> <strong>Statements</strong> <strong>2010</strong><br />
(€ m)<br />
<strong>2010</strong> 2009<br />
Net prOfit 798 1,152<br />
Non-cash items included in net pr<strong>of</strong>it, and adjustments to reconcile net pr<strong>of</strong>it to cash flows from operating activities<br />
Depreciation, amortisation, net writedowns <strong>of</strong> loans, and changes in fair values 2,564 2,670<br />
Increase in staff-related provisions and other provisions 385 335<br />
Increase/decrease in other non-cash items –577 –34<br />
Gains/losses on disposal <strong>of</strong> intangible assets, property, plant and equipment, and investments –76 –150<br />
sub-tOtal 3,094 3,973<br />
Increase/decrease in operating assets and liabilities after adjustment for non-cash components<br />
<strong>Financial</strong> assets held for trading –16 6,739<br />
Loans and receivables with banks and customers –5,046 16,731<br />
Other asset items –18,961 –656<br />
<strong>Financial</strong> liabilities held for trading 1,202 –5,910<br />
Deposits from banks and customers 3,294 –17,769<br />
Debt securities in issue –348 –3,451<br />
Other liabilities items 15,886 82<br />
cash flOWs frOm OperatiNg actiVities –895 –261<br />
Proceeds from disposal <strong>of</strong><br />
investments 5,572 6,377<br />
property, plant and equipment 70 73<br />
Payments for purchases <strong>of</strong><br />
investments –11,274 –5,922<br />
property, plant and equipment –353 –306<br />
Proceeds from sales (less cash disposed <strong>of</strong>) <strong>of</strong> subsidiaries 5,976 53<br />
Payments for acquisition (less cash acquired) <strong>of</strong> subsidiaries – –<br />
Other changes –190 –355<br />
cash flOWs frOm iNVestiNg actiVities –199 –80<br />
Proceeds from capital increase 2,000 –<br />
Dividends paid – –<br />
Subordinated liabilities and other financial activities (net) –1,131 –319<br />
cash flOWs frOm fiNaNciNg actiVities 869 –319<br />
cash aNd cash equiValeNts at eNd Of preViOus periOd 3,244 3,929<br />
Cash flows from operating activities –895 –261<br />
Cash flows from investing activities –199 –80<br />
Cash flows from financing activities 869 –319<br />
Effects <strong>of</strong> exchange rate changes 11 –25<br />
cash aNd cash equiValeNts at eNd Of periOd 3,030 3,244<br />
paymeNts fOr taxes, iNterest aNd diVideNds<br />
Income taxes paid – 91 –44<br />
Interest received 8,481 10,500<br />
Interest paid –4,026 –6,050<br />
Dividends received 66 83<br />
The amount <strong>of</strong> cash and cash equivalents stated in the statement <strong>of</strong> cash flows for 2009 also includes cash and cash equivalents <strong>of</strong> non-current assets and disposal groups classified as held for sale.<br />
55