Annual Financial Statements 2010 of Bank Austria
Annual Financial Statements 2010 of Bank Austria
Annual Financial Statements 2010 of Bank Austria

Create successful ePaper yourself
Turn your PDF publications into a flip-book with our unique Google optimized e-Paper software.
Consolidated <strong>Financial</strong> <strong>Statements</strong> in accordance with IFRSs<br />
C – Notes to the statement <strong>of</strong> financial position (CoNTINuED)<br />
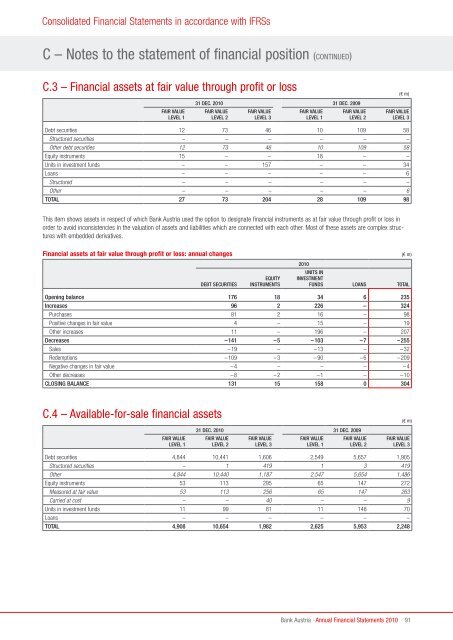
C.3 – <strong>Financial</strong> assets at fair value through pr<strong>of</strong>it or loss<br />
fair Value<br />
leVel 1<br />
31 dec. <strong>2010</strong> 31 dec. 2009<br />
fair Value<br />
leVel 2<br />
fair Value<br />
leVel 3<br />
fair Value<br />
leVel 1<br />
fair Value<br />
leVel 2<br />
This item shows assets in respect <strong>of</strong> which <strong>Bank</strong> <strong>Austria</strong> used the option to designate financial instruments as at fair value through pr<strong>of</strong>it or loss in<br />
order to avoid inconsistencies in the valuation <strong>of</strong> assets and liabilities which are connected with each other. Most <strong>of</strong> these assets are complex structures<br />
with embedded derivatives.<br />
<strong>Bank</strong> <strong>Austria</strong> · <strong>Annual</strong> <strong>Financial</strong> <strong>Statements</strong> <strong>2010</strong><br />
(€ m)<br />
fair Value<br />
leVel 3<br />
Debt securities 12 73 46 10 109 58<br />
Structured securities – – – – – –<br />
Other debt securities 12 73 46 10 109 58<br />
Equity instruments 15 – – 18 – –<br />
Units in investment funds – – 157 – – 34<br />
Loans – – – – – 6<br />
Structured – – – – – –<br />
Other – – – – – 6<br />
tOtal 27 73 204 28 109 98<br />
<strong>Financial</strong> assets at fair value through pr<strong>of</strong>it or loss: annual changes (€ m)<br />
debt securities<br />
equity<br />
iNstrumeNts<br />
<strong>2010</strong><br />
uNits iN<br />
iNVestmeNt<br />
fuNds lOaNs tOtal<br />
Opening balance 176 18 34 6 235<br />
increases 96 2 226 – 324<br />
Purchases 81 2 16 – 98<br />
Positive changes in fair value 4 – 15 – 19<br />
Other increases 11 – 196 – 207<br />
decreases –141 –5 –103 –7 –255<br />
Sales –19 – –13 – –32<br />
Redemptions –109 –3 – 90 –6 –209<br />
Negative changes in fair value –4 – – – –4<br />
Other decreases –8 –2 –1 – –10<br />
clOsiNg balaNce 131 15 158 0 304<br />
C.4 – Available-for-sale financial assets<br />
fair Value<br />
leVel 1<br />
31 dec. <strong>2010</strong> 31 dec. 2009<br />
fair Value<br />
leVel 2<br />
fair Value<br />
leVel 3<br />
fair Value<br />
leVel 1<br />
fair Value<br />
leVel 2<br />
(€ m)<br />
fair Value<br />
leVel 3<br />
Debt securities 4,844 10,441 1,606 2,549 5,657 1,905<br />
Structured securities – 1 419 1 3 419<br />
Other 4,844 10,440 1,187 2,547 5,654 1,486<br />
Equity instruments 53 113 295 65 147 272<br />
Measured at fair value 53 113 256 65 147 263<br />
Carried at cost – – 40 – – 9<br />
Units in investment funds 11 99 81 11 148 70<br />
Loans – – – – – –<br />
tOtal 4,908 10,654 1,982 2,625 5,953 2,248<br />
91