Decision support experiments and evaluations using seasonal to ...
Decision support experiments and evaluations using seasonal to ...
Decision support experiments and evaluations using seasonal to ...

You also want an ePaper? Increase the reach of your titles
YUMPU automatically turns print PDFs into web optimized ePapers that Google loves.
The U.S. Climate Change Science Program Chapter 2<br />
36<br />
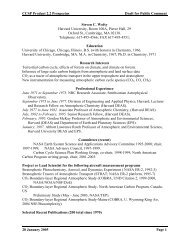
Streamflow Forecasts as of June 1, 2008<br />
Forecasts This Year<br />
Stream <strong>and</strong> Station Most Probable Reasonable<br />
Forecast<br />
Period<br />
kaf %avg<br />
Max<br />
%avg<br />
30 Year<br />
'71–'00<br />
Average<br />
Runoff<br />
Min<br />
&avg kaf<br />
Arkansas River Basin<br />
Arkansas River<br />
Granite at,CO Apr-Sep 260 124 177 118 210<br />
Salida at, CO Apr-Sep 450 145 177 118 310<br />
Canon City at, CO Apr-Sep 540 136 172 111 397<br />
Pueblo abv, CO<br />
Grape Creek West-<br />
Apr-Sep 650 134 167 105 485<br />
cliffe nr, CO<br />
Cucharas River<br />
Apr-Sep 33.0 168 245 107 19.6<br />
La Veta nr, CO<br />
Purga<strong>to</strong>ire River-<br />
Apr-Sep 11.1 85 108 68 13.0<br />
Trinidad at, CO<br />
Huerfano River<br />
Apr-Sep 32.0 73 107 48 44<br />
Redwing nr, CO<br />
Chalk Creek<br />
Apr-Sep 12.8 83 103 65 15.5<br />
Nathrop nr, CO<br />
Vermejo River<br />
Apr-Sep 43.0 159 2 1 1 115 27<br />
Dawson nr, NM<br />
Eagle Nest<br />
Reservoir Reser-<br />
Mar-Jun 6.20 89 113 7 3 7.0<br />
voir Inflow, NM<br />
Cimarron River<br />
Mar-Jun 14.70 126 143 118 11.7<br />
Cimarron nr, NM<br />
Ponil Creek<br />
Mar-Jun 18.60 117 138 106 15.9<br />
Cimarron nr, NM<br />
Rayado Creek<br />
Mar-Jun 6.10 91 109 81 6.7<br />
Sauble Ranch, NM Mar-Jun 5.90 83 101 73 7.1<br />
Figure 2.2 Example of NRCS tabular summer runoff (streamflow) volume<br />
forecast summary, showing median (“most probable”) forecasts <strong>and</strong> probabilistic<br />
confidence intervals, as well as clima<strong>to</strong>logical flow averages. Flow units are<br />
thous<strong>and</strong>-acre-feet (KAF), a runoff volume for the forecast period. This table<br />
was downloaded from .<br />
Figure 2.3 Example of NRCS spatial summer runoff (April-September<br />
streamflow) volume forecast summary, showing median runoff<br />
forecasts as an anomaly (percent of average).<br />
(Figure 2.3). Until 2006, the NWCC’s forecasts<br />
were released near the first of each month, for<br />
summer flow periods such as April through<br />
July or April through September. In 2006, the<br />
NWCC began <strong>to</strong> develop au<strong>to</strong>mated daily updates<br />
<strong>to</strong> these forecasts, <strong>and</strong> the daily product is<br />
likely <strong>to</strong> become more prevalent as development<br />
<strong>and</strong> testing matures. The NWCC has also just<br />
begun <strong>to</strong> explore the use of physically-based<br />
hydrologic models as a basis for forecasting.<br />
NWCC water supply forecasts are coordinated<br />
subjectively with a parallel set of forecasts<br />
produced by the western U.S. NWS River<br />
Forecast Centers (RFCs), <strong>and</strong> with forecasts<br />
from Environment Canada’s BC Hydro. The<br />
NRCS-NWS joint, official forecasts are of the<br />
subjective consensus type described earlier,<br />
so the final forecast products are subjective<br />
combinations of information from different<br />
sources, in this case, objective statistical <strong>to</strong>ols<br />
(i.e., regression models informed by observed<br />
snow water equivalent, accumulated water year<br />
precipitation, <strong>and</strong> streamflow) <strong>and</strong> model based<br />
forecast results from the RFCs.<br />
The NWS surface water supply forecast<br />
program began in the 1940s in the Colorado<br />
Basin. It has since exp<strong>and</strong>ed <strong>to</strong> include <strong>seasonal</strong><br />
forecasts (of volume runoff during the<br />
spring <strong>to</strong> summer snow melt period) for most<br />
of the snowmelt-dominated basins important<br />
<strong>to</strong> water management in the western United<br />
States. These forecasts rely on two primary<br />
<strong>to</strong>ols: Statistical Water Supply (SWS), based<br />
on multiple-linear regression, <strong>and</strong> Ensemble<br />
Streamflow Prediction (ESP), a technique<br />
based on hydrologic modeling (Schaake, 1978;<br />
Day, 1985). Results from both approaches are<br />
augmented by forecaster experience <strong>and</strong> the<br />
coordination process with other forecasting<br />
entities. In contrast <strong>to</strong> the western RFCs, RFCs<br />
in the eastern United States are more centrally<br />
concerned with short <strong>to</strong> medium-range flood<br />
risk <strong>and</strong> drought-related water availability out <strong>to</strong><br />
about a three month lead time. At some eastern<br />
RFC websites, the <strong>seasonal</strong> forecast is linked<br />
only <strong>to</strong> the CPC Drought Outlook rather than<br />
an RFC-generated product (Box 2.3).<br />
The streamflow prediction services of the RFCs<br />
have a national presence, <strong>and</strong>, as such, are able<br />
<strong>to</strong> leverage a number of common technologi-