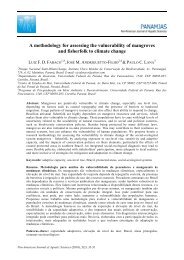
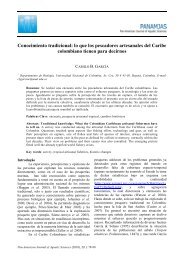
312D.F.M GHERARDI ET ALLIface too many uncertainties regarding theeffectiveness of response policy measures. Also,managers responsible for mitigation programmesand action plans aimed at dealing with climatechange impacts on marine and coastal ecosystemsmay find it difficult to envisage the necessary sitespecificmanagement strategies for multiple stressors(Higgason & Brown 2009). This is an important<strong>issue</strong> because the reduction in carrying capacity canbe coupled with density-dependence effects onbiomass changes of small pelagic fish species, suchas observed with the Japanese sardine (Yatsu et al.2008). As large-scale climatic-induced regime shiftsare modulated by local physical conditions, this willmost likely impose time-lagged changes onbiological production at lower trophic levels (e. g.mesozooplankton). Recen-tly, Gigliotti et al. (2010)showed that the interannual variability of eggconcentration of the Brazilian sardine can be relatedto the expansion and contraction of the spawninghabitat. The Brazilian sardine is capable of exploringsuitable spawning sites provided by the entrainmentof the colder and less saline South Atlantic CentralWater (SACW) onto the shelf due to the combinedeffect of coastal wind-driven and meander inducedupwelling.The purpose of this paper is to present someexploratory results that point to importantdifferences between the spatial patterns ofcorrelation of climate indices and SST anomalies(SSTA), and the geographic arrangement of LMEsfor Brazil (North Brazil, East Brazil, and SouthBrazil Shelf), as recently discussed in Sherman et al.(2009). The consequences of such differences to thestudy of the impacts of climate variability in theseLMEs are discussed.Materials and MethodsClimate indices calculated as SST anomalyaverages were obtained for three different areas:Niño 3 limited at 5° S, 5° N and 150° W, 90° W;Tropical North Atlantic (TNA) bounded at 5.5° N,23.5° N and 15° W 57.5° W; and Tropical SouthAtlantic (TSA) at 0°, 20° S and 10° E 30° W(Fig. 2). These indices are the same used in otherstudies of tropical Atlantic climate variability(Enfield et al. 1999, Kayano et al. 2009) and areavailable at http://www.esrl.noaa.gov/psd/. The SSTdata used in this work are the monthly gridded seriesfrom 1948 to 2008, with a spatial resolution of 2° inlatitude and longitude, derived from the version 3 ofthe reconstructed SST data set, described by Smithet al. (2008). These data can be freely downloadedfrom http://migre.me/3Hy49. The AntarcticOscillation Index (AAO), also known as theSouthern Hemisphere Annular Mode (Kidson 1988,Thompson & Wallace 2000) is calculated byprojecting the monthly mean 700 hPa geopotentialheight (normalized) anomalies poleward of 20°Sonto the leading Empirical Orthogonal Function(EOF) mode of these anomalies from 1979 to 2000.The AAO describes a mass seesaw between thesouthern mid and high latitudes, with positive(negative) values representing above (below) normalgeopotential height in the midlatitudes and below(above) normal geopotential height in the highlatitudes. The monthly AAO dataset corresponds tothe period from 1979 to 2007, available athttp://www.cpc.noaa.gov/products/precip/CWlink/daily_ao_index/aao/aao.shtml.Figure 2. Location of areas from which the climate indices have been calculated.Pan-American Journal of Aquatic Sciences (2010), 5(2): 310-319
Climate variability and large marine ecosystems in the western South Atlantic313In order to determine the spatial patterns ofinterannual SSTA variability along the Braziliancoast associated with global climate change,correlations between Niño 3, TNA, TSA and AAOindices and the SST anomaly field were calculatedfor the area between 10ºN to 40ºS and 62ºW to26ºW. The influence of the Pacific DecadalOscillation (PDO) shift on correlations wasinvestigated by dividing the complete time series(1948 to 2008) in the cold PDO phase from 1948 to1976, and the warm PDO phase from 1977 to 2008(Mantua et al. 1997). Correlations were carried outfor each grid point in the study area using linearlydetrended, standardized and filtered data. Filteringprocedure made use of a Morlet wavelet as abandpass filter (Torrence & Compo 1998) to retainonly the interannual variability between 2 and 7years. The cross correlation time lags used in theanalyses apply to all grid points and were selectedbased on the higher significance value obtained foreach climate index. The statistical significance of allcorrelations has been assessed by Student’s t-test ata 95% confidence level and only significantcorrelations are presented in the results section. Thenumber of degrees of freedom (DOF) wasdetermined by dividing the total time length of theseries by the time lag needed to achievedecorrelation time closest to zero (Servain et al.2000, Kayano et al. 2009). Only the lower values forthe number of DOFs were adopted, so that the test isthe most severe.ResultsFor the sake of simplicity, all correlationsbetween the climate indices and SSTAs along theBrazilian coast will be referred to only in terms ofthe indices used in each case. Maximum positivecorrelations of 0.7 with the Niño 3 are found alongthe eastern coast and offshore the northern coast ofBrazil and to the north of the equator after a time lagof eight months (Fig. 3). This time lag has been alsoreported by Lanzante (1996) and indicates that underan El Niño (La Niña) the surface waters in theseareas of the tropical Atlantic are anomalouslywarmed (cooled) eight months later. Possibly, themost striking aspect of the correlation fields is themarked spatial differences between the cold andwarm PDO phases, namely the lack of positivecorrelation in the South Brazil (SB) LME during thewarm PDO. Positive correlations with values up to0.6 appear at the SB LME and up to 0.7 offshore forthe cold phase only. It is also important to note thatduring the warm PDO, correlations in the EB LMEare mostly located in its southern half, characterizedby high (up to 0.7) values. This suggests a separationbetween the two halves of the EB LME, in terms ofthe decadal SSTA variability. It is worth noting thatto the north of the equator correlations aresignificantly lower for the warm phase of the PDOthan for the cold phase.The TNA achieves higher positivecorrelations after one month lag but has a limitedimpact on the SSTA along the Brazilian coast (Fig.3). During the cold phase of the PDO the northBrazil coast experienced the highest correlations, butthese are greatly reduced moving offshore in thefollowing warm phase. In fact, there is no significantcorrelation for the TNA along the north Braziliancoast during the warm phase. On the other hand,significant correlation of 0.5, restricted to a smallarea in the eastern coast in the cold phase, evolvesinto a wide northwest-southeast correlation band.This extends towards the subtropical portion of thecentral south Atlantic in the subsequent warm phase.So, for the warm PDO, an anomalous warmed(cooled) TNA relates to an anomalous warmed(cooled) subtropical South Atlantic.Not surprisingly, the TSA achieves thehighest correlation (with zero lag) in the northernand eastern portions of Brazilian coast, with thelatter being more developed during the warm PDOphase (Fig. 3). This appears to be the result of theproximity with the area of the tropical Atlanticwhere the TSA is calculated. Furthermore, thepositive correlation pattern also resembles the SSTequatorial mode previously detected by Zebiak(1993) and Wagner & da Silva (1994). Theseauthors showed that a significant part of theobserved SST interannual variability in the tropicalAtlantic is related to an internal Atlantic equatorialmode similar to the ENSO in the Pacific. A newfeature, however, emerges for the warm phasecharacterized by negative correlation values as highas -0.6 along the southern limit of the SB LME. Forthe warm PDO phase, anomalously warm (cold)surface waters in the TSA relate to cold (warm) thannormal surface waters in the South Atlantic to thesouth of 35°S. It is worth noting the lack ofsignificant correlations in the area under theinfluence of the South Atlantic ConvergenceZone(SACZ), similar to the observed pattern for theNiño 3 and TNA indices. The SACZ is an elongatedconvective band that originates in the Amazon basinextending to the southeastern Atlantic Ocean,responsible for extreme precipitation events andstrongly influenced by warm ENSO events thatfavors its persistence over de Atlantic (Carvalho etal. 2004).It takes six months for the AAO to developthe highest positive correlations along the SB LMEPan-American Journal of Aquatic Sciences (2010), 5(2): 310-319