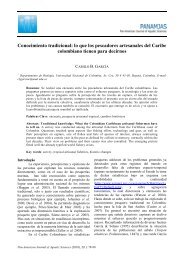
342M. B. S. F. COSTA ET ALLIcoastal aquifers and rives – but could also result incomplete suppression of sandy beaches and wetlands(Snoussi et al. 2007).Such an impact, although felt globally,depends on local peculiarities; therefore, happensunevenly across countries, regions, communitiesand individuals as the result of different levels ofexposure and vulnerability (Clark et al. 1998).Moreover, adapting coastal regions represent alarger challenge to developing countries than itdoes to developed ones, because of economiclimitations. As an option for minimizing sucheffects, vulnerability and impact assessmentprovides a starting point for guidance in decisionmaking for effective measures that envisionimpact reduction and reestablishment of initialconditions.In Brazil, sea level trends for differentplaces are sparing. For Recife, specifically, Harariet al. (2008) pointed a sea level rise of about5.6 mm.year -1 . In spite of this gap, some studieshave been dedicated to the coastal predictions infront of future sea level sceneries, as Alfrediniet al. (2008), which describes islands and coastalurban areas as the most vulnerable to floodingin medium and long terms. Another study, madeby Marengo et al. (2007) in national scale,pointed Pernambuco as one of the most affectedstates by the increasing on the sea level, atthis moment and potentially. The same conclusionis showed by two another studies: Neveset al. (2007) and Naccarati (2008). According tothese authors, both, natural and occupationcharacteristics contribute for the vulnerability of thearea.The Metropolitan Center of Recife combineslow topography, intense urbanization, highdemographic density, and elevated ecological,tourist and economic values (Araújo et al. 2009).Furthermore, it presents several conflicts in coastalland and shoreline usage, which is one of thereasons it became one of the first regions in Brazil tobe the subject of integrated studies on theproblems of coastal erosion, with the collaborationof several spheres of public power (FINEP/UFPE,2008).Within this context, the goal of this paperis to present possible scenarios for MetropolitanCenter of Recife, prompted by the rise in theaverage sea level trend forecasted by the IPCCemission scenarios. The aim is to foresee scenariosthat will raise awareness in the decision makers, aswell as to point out possible strategies forminimization of potential impacts of the rise in sealevel in this region.MethodologyDescription of study areaThe Metropolitan Center of Recife, whichcovers the cities of Paulista, Olinda, Recife andJaboatão dos Guararapes, is located on the coast ofthe state of Pernambuco (Fig. 1) and extends over asedimentary plain, with an average altitude of 4 m.The region presents Tropical Atlantic climate withan average annual temperature of 27oC and annualpluviosity of around 2000 mm unequally distributedbetween dry and rainy periods. The wind regime isgoverned by the general atmospheric pressuredistribution pattern of the South Atlantic Ocean,with predominance of SE winds.The tides registered in the region are allsemi-diurnal and classified as mesotidal in terms ofamplitude. The largest and smallest swells occur inthe months of September and January, respectively,with significant wave periods between 5.1 and 6.8seconds. The significant wave height varies betweeneach location, with values of 0.29/0.27 for Paulista;0.6/0.61 for Olinda; 0.97/0.66 for Recife and0.61/0.44 for Jaboatão dos Guararapes (FINEP/UFPE, 2008).The main ecosystems in this region aremangroves, fragments of Atlantic Forest, coral reefs,and restinga. The hydrographic system is welldrained, with several rivers, streams and lakes. TheCapibaribe River is the main watercourse.Establishing Potential Flood ZonesThe methodological steps proposed byHoozemans et al. (1993), Snoussi et al. (2007) andVargas et al. (2008) were followed, withdetermination of the resulting flood levels by thesum of the factors involved in the sea level rise.Therefore, the contributions of the followingextreme water level-induced phenomena weresimulated: maximum high water line in the last 20years; sea level rise due to storm surge(meteorological tide plus wave run up)(FINEP/UFPE, 2008); projected sea level rise for theFigure 1. Location of the studied coastal area in theMetropolitan Center of Recife, Northeast Brazil.Pan-American Journal of Aquatic Sciences (2010) 5(2): 341-349
Vulnerability and impacts related to the rising sea level343next century (IPCC, 2007), which can be optimistic(+0.5 m by 2100, or about 5 mm·year -1 ) or critical (+1.0 m by 2100, about 10 mm·year -1 ). These scenarioswere adapted from the IPCC Emission Scenarios(B1 and A2), considering that the sea level rise forthe next century may be up to roughly twice themaximum projection found in this report (Rohling etal. 2008). Equations (I) and (II) express theempirical approach used to determine the floodlevels in coastal and estuary areas, respectively.NI = PM + MM + SLR (Eq. I)NI = PM + SLR (Eq. II)where NI – Flood Level; PM – maximum high tidewater level; MM –Meteorological Tide (includingwave run up); SLR – Sea Level Rise.For delimitation of potential flood zones, aGeographic Information System (GIS) was used.Rectified aerial photography in a 1:2000 scale(Pernambuco, 1974) was processed in order todigitalize the flood level lines. The entire territorialportion below such levels, therefore, wouldpotentially be flooded in similar conditions to theones in the above modeled scenarios.The rectified aerial photography employs theaverage sea level in Imbituba, South Brazil,established by the Brazilian Institute of Geographyand Statistics (IBGE). According to Neves & Muehe(1995), it is located 1.106 m above the datum usedby the Hydrography and Navigation Board (DHN).The values considered and the resulting levels are inTable I.Attribution of Degrees of Vulnerability to theShorelineBearing in mind that sandy beaches serve asa buffer, reducing the energy that the oceans imposeto the shore, one can say that the closer the firstman-made structures are to the shoreline, the highertheir degree of vulnerability to the impacts oferosion and floods (Lathrop Jr. & Love, 2007).Accordingly, the degree of vulnerability wasassigned based on the current capacity of thebeaches of the Metropolitan Center of Recife toprotect inland resources, be they economic,ecological or of cultural values.To calculate the average distance betweenthe maximum high water line and the closestinfrastructure, a spatial analysis module available ina GIS environment was used. The line of first manmadestructures was taken from UNIBASE (2002) –a cartographic base on a 1:1.000 scale – and theshoreline was obtained in situ using geodesic GPSequipment. The marker used was the High WaterLine, or HWL.Once the distances were calculated, limitvalues were established for each degree ofvulnerability (Table II). In order to fulfill the safetyconditions, beaches should not only present abackshore, but this sector should also be at least 30m wide (FINEP/UFPE, 2008). This value wasestablished through an estimation of the resultsobtained by Pajak & Leatherman (2002) and Costaet al. (2008) on the variation of the HWL positionthrough time.Analysis of the Coastal Resources at RiskIn a GIS environment, a layer containing thepotential flood zones was superimposed to the layercontaining occupation information. The resources atrisk were divided into the following categories:wetland (mangrove and flooded areas), unoccupiedland, beaches, buildings with over three floors,buildings with less than three floors andhistorical/cultural patrimony.Table I. Values considered for the estimation of the levels in risk of flooding.ScenarioMaximum high tidewater level (m)Storm surge effect SLR (m) Flood level (m)Optimistic 2.7 (– 1.106) 1.0 0.5 3.1Critical 2.7 (– 1.106) 1.0 1.0 3.6Table II. Criteria used in the determination of the Degree of Vulnerability.Backshore width (m) Degree of vulnerability Maintenance priorityNull* Conditional Constant maintenance>30 Low Moderate