Download full issue - PanamJAS
Download full issue - PanamJAS
Download full issue - PanamJAS
- No tags were found...

You also want an ePaper? Increase the reach of your titles
YUMPU automatically turns print PDFs into web optimized ePapers that Google loves.
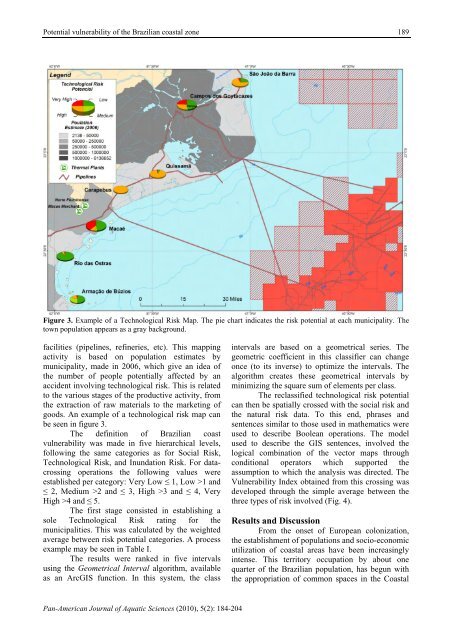
Potential vulnerability of the Brazilian coastal zone189Figure 3. Example of a Technological Risk Map. The pie chart indicates the risk potential at each municipality. Thetown population appears as a gray background.facilities (pipelines, refineries, etc). This mappingactivity is based on population estimates bymunicipality, made in 2006, which give an idea ofthe number of people potentially affected by anaccident involving technological risk. This is relatedto the various stages of the productive activity, fromthe extraction of raw materials to the marketing ofgoods. An example of a technological risk map canbe seen in figure 3.The definition of Brazilian coastvulnerability was made in five hierarchical levels,following the same categories as for Social Risk,Technological Risk, and Inundation Risk. For datacrossingoperations the following values wereestablished per category: Very Low ≤ 1, Low >1 and≤ 2, Medium >2 and ≤ 3, High >3 and ≤ 4, VeryHigh >4 and ≤ 5.The first stage consisted in establishing asole Technological Risk rating for themunicipalities. This was calculated by the weightedaverage between risk potential categories. A processexample may be seen in Table I.The results were ranked in five intervalsusing the Geometrical Interval algorithm, availableas an ArcGIS function. In this system, the classintervals are based on a geometrical series. Thegeometric coefficient in this classifier can changeonce (to its inverse) to optimize the intervals. Thealgorithm creates these geometrical intervals byminimizing the square sum of elements per class.The reclassified technological risk potentialcan then be spatially crossed with the social risk andthe natural risk data. To this end, phrases andsentences similar to those used in mathematics wereused to describe Boolean operations. The modelused to describe the GIS sentences, involved thelogical combination of the vector maps throughconditional operators which supported theassumption to which the analysis was directed. TheVulnerability Index obtained from this crossing wasdeveloped through the simple average between thethree types of risk involved (Fig. 4).Results and DiscussionFrom the onset of European colonization,the establishment of populations and socio-economicutilization of coastal areas have been increasinglyintense. This territory occupation by about onequarter of the Brazilian population, has begun withthe appropriation of common spaces in the CoastalPan-American Journal of Aquatic Sciences (2010), 5(2): 184-204