
Create successful ePaper yourself
Turn your PDF publications into a flip-book with our unique Google optimized e-Paper software.
<strong>Vectron</strong> <strong>Systems</strong> <strong>AG</strong><br />
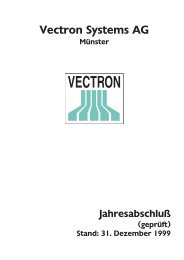
2009E, too. However, we expect this trend to reverse and <strong>Vectron</strong> to return to its<br />
past strength of cash generation in its operating business from FY 2010E on.<br />
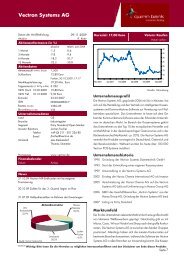
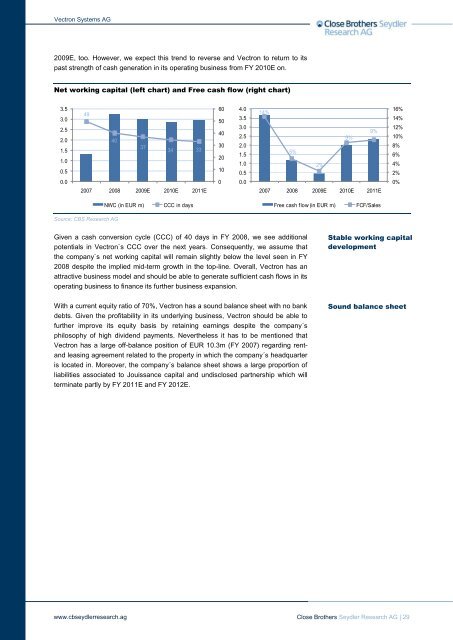
Net working capital (left chart) and Free cash flow (right chart)<br />
3.5<br />
3.0<br />
2.5<br />
2.0<br />
1.5<br />
1.0<br />
0.5<br />
0.0<br />
49<br />
40<br />
Source: CBS Research <strong>AG</strong><br />
Given a cash conversion cycle (CCC) of 40 days in FY 2008, we see additional<br />
potentials in <strong>Vectron</strong>`s CCC over the next years. Consequently, we assume that<br />
the company`s net working capital will remain slightly below the level seen in FY<br />
2008 despite the implied mid-term growth in the top-line. Overall, <strong>Vectron</strong> has an<br />
attractive business model and should be able to generate sufficient cash flows in its<br />
operating business to finance its further business expansion.<br />
With a current equity ratio of 70%, <strong>Vectron</strong> has a sound balance sheet with no bank<br />
debts. Given the profitability in its underlying business, <strong>Vectron</strong> should be able to<br />
further improve its equity basis by retaining earnings despite the company´s<br />
philosophy of high dividend payments. Nevertheless it has to be mentioned that<br />
<strong>Vectron</strong> has a large off-balance position of EUR 10.3m (FY 2007) regarding rentand<br />
leasing agreement related to the property in which the company´s headquarter<br />
is located in. Moreover, the company´s balance sheet shows a large proportion of<br />
liabilities associated to Jouissance capital and undisclosed partnership which will<br />
terminate partly by FY 2011E and FY 2012E.<br />
www.cbseydlerresearch.ag<br />
37<br />
34 33<br />
2007 2008 2009E 2010E 2011E<br />
NWC (in EUR m) CCC in days<br />
60<br />
50<br />
40<br />
30<br />
20<br />
10<br />
0<br />
4.0<br />
3.5<br />
3.0<br />
2.5<br />
2.0<br />
1.5<br />
1.0<br />
0.5<br />
0.0<br />
14%<br />
5%<br />
2%<br />
9%<br />
9%<br />
2007 2008 2009E 2010E 2011E<br />
Free cash flow (in EUR m) FCF/Sales<br />
16%<br />
14%<br />
12%<br />
10%<br />
8%<br />
6%<br />
4%<br />
2%<br />
0%<br />
Stable working capital<br />
development<br />
Sound balance sheet<br />
Close Brothers Seydler Research <strong>AG</strong> | 29