
You also want an ePaper? Increase the reach of your titles
YUMPU automatically turns print PDFs into web optimized ePapers that Google loves.
<strong>Vectron</strong> <strong>Systems</strong> <strong>AG</strong><br />
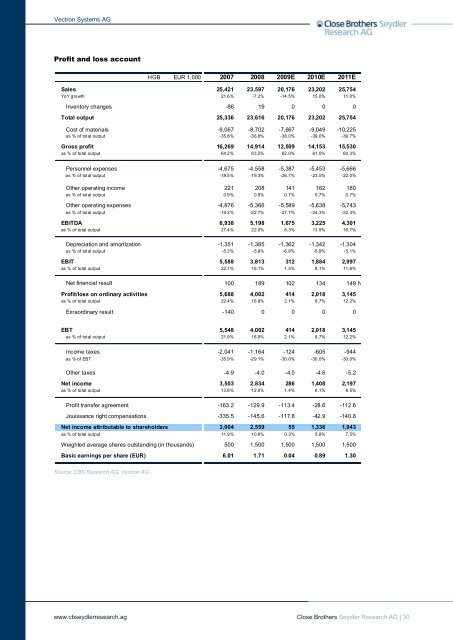
Profit and loss account<br />
Source: CBS Research <strong>AG</strong>, <strong>Vectron</strong> <strong>AG</strong><br />
www.cbseydlerresearch.ag<br />
HGB EUR 1,000 2007 2008 2009E 2010E 2011E<br />
Sales 25,421 23,597 20,176 23,202 25,754<br />
YoY growth 21.6% -7.2% -14.5% 15.0% 11.0%<br />
Inventory changes -86 19 0 0 0 Herstellungskosten der zur Erzielu<br />
Total output 25,336 23,616 20,176 23,202 25,754<br />
Cost of materials -9,067 -8,702 -7,667 -9,049 -10,225<br />
as % of total output -35.8% -36.8% -38.0% -39.0% -39.7%<br />
Gross profit 16,269 14,914 12,509 14,153 15,530<br />
as % of total output 64.2% 63.2% 62.0% 61.0% 60.3%<br />
Personnel expenses -4,675 -4,558 -5,387 -5,453 -5,666<br />
as % of total output -18.5% -19.3% -26.7% -23.5% -22.0%<br />
Other operating income 221 208 141 162 180<br />
as % of total output 0.9% 0.9% 0.7% 0.7% 0.7%<br />
Other operating expenses -4,876 -5,366 -5,589 -5,638 -5,743 Sonstige betriebliche Aufwendunge<br />
as % of total output -19.2% -22.7% -27.7% -24.3% -22.3%<br />
EBITDA 6,938 5,198 1,675 3,225 4,301<br />
as % of total output 27.4% 22.0% 8.3% 13.9% 16.7%<br />
Depreciation and amortization -1,351 -1,385 -1,362 -1,342 -1,304<br />
as % of total output -5.3% -5.9% -6.8% -5.8% -5.1%<br />
EBIT 5,588 3,813 312 1,884 2,997<br />
as % of total output 22.1% 16.1% 1.5% 8.1% 11.6%<br />
Net financial result 100 189 102 134 149 Net financial result including interest ex<br />
Profit/loss on ordinary activities 5,688 4,002 414 2,018 3,145<br />
as % of total output 22.4% 16.9% 2.1% 8.7% 12.2%<br />
Exraordinary result -140 0 0 0 0<br />
EBT<br />
5,548 4,002 414 2,018 3,145<br />
as % of total output 21.9% 16.9% 2.1% 8.7% 12.2%<br />
Income taxes -2,041 -1,164 -124 -605 -944<br />
as % of EBT -35.9% -29.1% -30.0% -30.0% -30.0%<br />
Other taxes -4.9 -4.0 -4.0 -4.6 -5.2 Währungsumrechnungsgewinne u<br />
Net income 3,503 2,834 286 1,408 2,197 Net income attributable to shareho<br />
as % of total output 13.8% 12.0% 1.4% 6.1% 8.5%<br />
Profit transfer agreement -163.2 -129.9 -113.4 -28.6 -112.6<br />
Jouissance right compensations -335.5 -145.6 -117.8 -42.9 -140.8<br />
Net income attributable to shareholders 3,004 2,559 55 1,336 1,943 Net income attributable to shareho<br />
as % of total output 11.9% 10.8% 0.3% 5.8% 7.5%<br />
Weighted average shares outstanding (in thousands) 500 1,500 1,500 1,500 1,500 Achtung, Einheit der Anzahl Aktien<br />
Basic earnings per share (EUR) 6.01 1.71 0.04 0.89 1.30<br />
Close Brothers Seydler Research <strong>AG</strong> | 30