
Create successful ePaper yourself
Turn your PDF publications into a flip-book with our unique Google optimized e-Paper software.
<strong>Vectron</strong> <strong>Systems</strong> <strong>AG</strong><br />
partners. Wincor Nixdorf possesses a high grade of internationalization, having its<br />
own subsidiaries in 37 countries and a market presence in around 100 countries<br />
around the world. In FY 2007/2008, ended in September 30, the company<br />
generated revenues of EUR 2.3bn and a net income of EUR 127m. Comparability<br />
to <strong>Vectron</strong> is only given in Wincor´s retail business where the company delivers<br />
POS <strong>Systems</strong> to customers with high branch concentration. Overall Wincor<br />
operates in this business segment as a pure manufacturer.<br />
Multiples and derived value<br />
In our peer group analysis, we considered multiples for the fiscal years 2009E and<br />
2010E. We applied different multiples including EV/EBITDA in order to account for<br />
special situation related to <strong>Vectron</strong>´s high depreciation expenses. In the course of<br />
the management-buy-out, <strong>Vectron</strong> had acquired softrwarecodes which the<br />
company has to write-off until 2012E.<br />
Given the current volatility at the stock markets and the fact that <strong>Vectron</strong> is rather a<br />
small player compared to the global operating peers, we decided to weight the peer<br />
group valuation with only 33.3% in our overall valuation approach.<br />
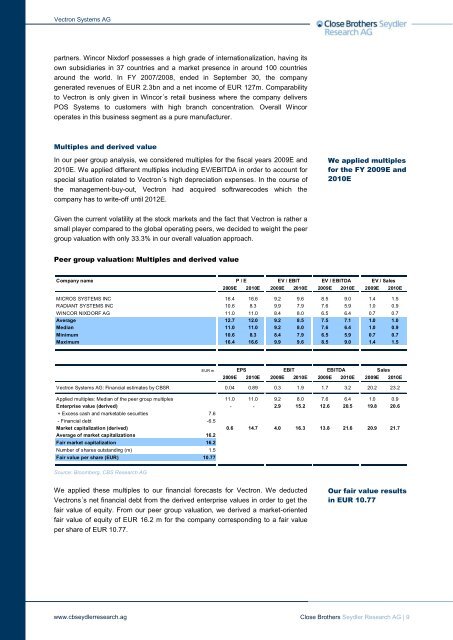
Peer group valuation: Multiples and derived value<br />
Company name<br />
Source: Bloomberg, CBS Research <strong>AG</strong><br />
We applied these multiples to our financial forecasts for <strong>Vectron</strong>. We deducted<br />
<strong>Vectron</strong>s´s net financial debt from the derived enterprise values in order to get the<br />
fair value of equity. From our peer group valuation, we derived a market-oriented<br />
fair value of equity of EUR 16.2 m for the company corresponding to a fair value<br />
per share of EUR 10.77.<br />
www.cbseydlerresearch.ag<br />
2009E 2010E 2009E 2010E 2009E 2010E 2009E 2010E<br />
MICROS SYSTEMS INC 16.4 16.6 9.2 9.6 8.5 9.0 1.4 1.5<br />
RADIANT SYSTEMS INC 10.6 8.3 9.9 7.9 7.6 5.9 1.0 0.9<br />
WINCOR NIXDORF <strong>AG</strong> 11.0 11.0 8.4 8.0 6.5 6.4 0.7 0.7<br />
Average 12.7 12.0 9.2 8.5 7.5 7.1 1.0 1.0<br />
Median 11.0 11.0 9.2 8.0 7.6 6.4 1.0 0.9<br />
Minimum 10.6 8.3 8.4 7.9 6.5 5.9 0.7 0.7<br />
Maximum 16.4 16.6 9.9 9.6 8.5 9.0 1.4 1.5<br />
EUR m<br />
2009E 2010E 2009E 2010E 2009E 2010E 2009E 2010E<br />
<strong>Vectron</strong> <strong>Systems</strong> <strong>AG</strong>: Financial estimates by CBSR 0.04 0.89 0.3 1.9 1.7 3.2 20.2 23.2<br />
Applied multiples: Median of the peer group multiples 11.0 11.0 9.2 8.0 7.6 6.4 1.0 0.9<br />
Enterprise value (derived) - - 2.9 15.2 12.6 20.5 19.8 20.6<br />
+ Excess cash and marketable securities 7.6<br />
- Financial debt -6.5<br />
Market capitalization (derived) 0.6 14.7 4.0 16.3 13.8 21.6 20.9 21.7<br />
Average of market capitalizations 16.2<br />
Fair market capitalization 16.2<br />
Number of shares outstanding (m) 1.5<br />
Fair value per share (EUR) 10.77<br />
EPS EBIT EBITDA<br />
We applied multiples<br />
for the FY 2009E and<br />
2010E<br />
P / E EV / EBIT EV / EBITDA EV / Sales<br />
Sales<br />
Our fair value results<br />
in EUR 10.77<br />
Close Brothers Seydler Research <strong>AG</strong> | 9