
Create successful ePaper yourself
Turn your PDF publications into a flip-book with our unique Google optimized e-Paper software.
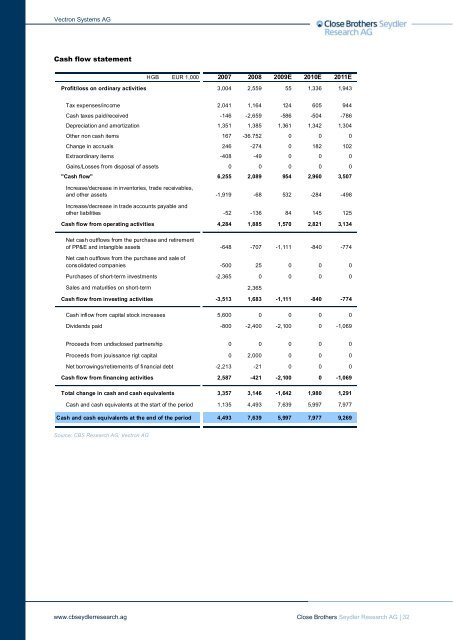
<strong>Vectron</strong> <strong>Systems</strong> <strong>AG</strong><br />
Cash flow statement<br />
Source: CBS Research <strong>AG</strong>, <strong>Vectron</strong> <strong>AG</strong><br />
www.cbseydlerresearch.ag<br />
HGB EUR 1,000 2007 2008 2009E 2010E 2011E<br />
Profit/loss on ordinary activities 3,004 2,559 55 1,336 1,943<br />
Tax expenses/income<br />
Cash taxes paid/received<br />
Depreciation and amortization<br />
Other non cash items<br />
Change in accruals<br />
Extraordinary items<br />
Gains/Losses from disposal of assets<br />
2,041 1,164 124 605 944<br />
-146 -2,659 -586 -504 -786<br />
1,351 1,385 1,361 1,342 1,304<br />
167 -36.752 0 0 0<br />
246 -274 0 182 102<br />
-408 -49 0 0 0<br />
0 0 0 0 0<br />
"Cash flow" 6,255 2,089 954 2,960 3,507<br />
Increase/decrease in inventories, trade receivables,<br />
and other assets<br />
Increase/decrease in trade accounts payable and<br />
other liabilities<br />
-1,919 -68 532 -284 -498<br />
-52 -136 84 145 125<br />
Cash flow from operating activities 4,284 1,885 1,570 2,821 3,134<br />
Net cash outflows from the purchase and retirement<br />
of PP&E and intangible assets<br />
Net cash outflows from the purchase and sale of<br />
consolidated companies<br />
Purchases of short-term investments<br />
Sales and maturities on short-term 2,365<br />
-648 -707 -1,111 -840 -774<br />
-500 25 0 0 0<br />
-2,365 0 0 0 0<br />
Cash flow from investing activities -3,513 1,683 -1,111 -840 -774<br />
Cash inflow from capital stock increases<br />
Dividends paid<br />
Proceeds from undisclosed partnership<br />
Proceeds from jouissance rigt capital<br />
Net borrowings/retirements of financial debt<br />
5,600 0 0 0 0<br />
-800 -2,400 -2,100 0 -1,069<br />
0 0 0 0 0<br />
0 2,000 0 0 0<br />
-2,213 -21 0 0 0<br />
Cash flow from financing activities 2,587 -421 -2,100 0 -1,069<br />
Total change in cash and cash equivalents 3,357 3,146 -1,642 1,980 1,291<br />
Cash and cash equivalents at the start of the period<br />
1,135 4,493 7,639 5,997 7,977<br />
Cash and cash equivalents at the end of the period 4,493 7,639 5,997 7,977 9,269<br />
Close Brothers Seydler Research <strong>AG</strong> | 32