Morphology and plasmonic properties of self-organized arrays of ...
Morphology and plasmonic properties of self-organized arrays of ...
Morphology and plasmonic properties of self-organized arrays of ...

Create successful ePaper yourself
Turn your PDF publications into a flip-book with our unique Google optimized e-Paper software.
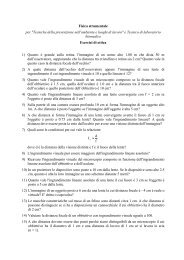
14 CHAPTER 1. THEORY≈ ω 0 like ε L 2. Indeed, if ε L 2 were much smaller than ε L 1, it would follow N ≈ √ ε L 1 <strong>and</strong>K ≈ ε L 2/2 √ ε L 1 . This correspondence, however, is only valid for gaseous phases, wherethe density <strong>of</strong> atoms is very low, while for solids it is only approximate because the absorptionsare very strong; nevertheless, the absorption peak is generally observed at afrequency very close to ω 0 .Equation (1.13) can be generalized to include the contributions <strong>of</strong> several concomitantresonances occurring in the same medium at different frequencies, writing:ε(ω) = 1+ ∑ jA jω 2 0j −ω2 +iΓ j ω(1.14)where j is the index numbering the (supposed discrete) oscillators <strong>of</strong> the medium. Theoverall frequency dependence <strong>of</strong> the dielectric constants according to eq. (1.14) is schematicallyshown in fig. 1.4. 1 200Drude1Cauchyω 0,1ω 0,2ω 0,3FrequencyFigure 1.4: Schematic diagram <strong>of</strong> the frequency dependence <strong>of</strong> the dielectric function <strong>of</strong>an hypothetical solid with three resonant frequencies (ω 0,i ). The Drude contribution issketched in dashed lines at the lowest frequencies; an example <strong>of</strong> region <strong>of</strong> validity <strong>of</strong> theCauchy parametrization is highlighted at the center <strong>of</strong> the figure.This classical picture <strong>of</strong> the interaction between light <strong>and</strong> matter <strong>of</strong>fers a simple physicalinterpretation <strong>of</strong> the dielectric constant. Looking at fig. 1.4, we can identify partswhere ε 1 is slowly varying <strong>and</strong> ε 2 is almost null, <strong>and</strong> regions where ε 1 rapidly changes<strong>and</strong> ε 2 has a maximum. Moreover, every time a resonance is crossed, moving from low tohigh frequencies, the average value <strong>of</strong> ε 1 decreases, approaching the value <strong>of</strong> 1 beyond thelast oscillator. This can be understood in terms <strong>of</strong> polarizability <strong>of</strong> the material: consideringa single mechanism <strong>of</strong> polarization, the atoms can follow the external field, i.e. themedium can be polarized, only up to the resonance frequency, where the polarization ismaximum; at higher frequencies the field varies too fast <strong>and</strong> the average polarization reducesto zero. At very high frequencies, no polarization is more possible, <strong>and</strong> the materialbecomes completely transparent.