Morphology and plasmonic properties of self-organized arrays of ...
Morphology and plasmonic properties of self-organized arrays of ...
Morphology and plasmonic properties of self-organized arrays of ...

Create successful ePaper yourself
Turn your PDF publications into a flip-book with our unique Google optimized e-Paper software.
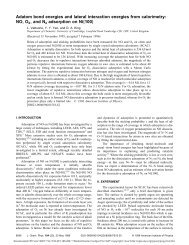
54 CHAPTER 3. SELF-ORGANIZED NPS ARRAYS: MORPH. ASPECTSafter the deposition <strong>of</strong> ≈ 250 nm <strong>of</strong> LiF at different temperatures, within the range between250 ◦ C <strong>and</strong> 400 ◦ C. In all cases the ripple structure is clearly recognizable <strong>and</strong> quiteregular. The ripples are very elongated especially at the lowest temperatures (T = 250 ◦ Cfor panel (a) <strong>and</strong> T = 300 ◦ C for panel (b)), where they extend longer than the imagesize (1μm) <strong>and</strong> are very straight. This is confirmed by the corresponding 2D Fourierspectra, which rapidly decay in the [001] direction <strong>and</strong> are much broader in the [1¯10]. Athigher temperatures, T = 350 ◦ C for panel (c) <strong>and</strong> T = 400 ◦ C for panel (d), the ripplesare more widely spaced but also more irregular; the average length is in-between 500 nm<strong>and</strong> 1μm, <strong>and</strong> the grooves appear slightly distorted. Looking at the 2D FFT spectra, thecentral peaks are still mainly spread in the [1¯10] direction, confirming that the uniaxialshape <strong>of</strong> the ripple remains the dominant feature <strong>of</strong> the surfaces, however an increasingbroadening in the [001] direction is also observed, indicating a gradual degradation <strong>of</strong>the ripples with the temperature. The broadening <strong>of</strong> the 2D Fourier spectra in the [1¯10]direction decreases with the ripples periodicity, however this is not an effect <strong>of</strong> disorder;in fact, the Fourier spectrum intensity for an ideal sawtooth pr<strong>of</strong>ile with period Λ decaysproportionally to 1/Λ 2 [188].From a statistical analysis <strong>of</strong> the AFM data, we could extract the average rippleperiodicity Λ along with its st<strong>and</strong>ard deviation; we report the results as a function <strong>of</strong>T in fig. 3.6. Λ follows an almost linear trend with the temperature, with a rate <strong>of</strong>approximately 1 nm/5 ◦ C: at 250 ◦ C the average ripple spacing is (25±2) nm (fig. 3.5(a));increasingT, Λraisesto(35±3)nmat300 ◦ C(fig.3.5(b)), (45±5)nmat350 ◦ C(fig.3.5(c))<strong>and</strong> (60±7) nm at 400 ◦ C (fig. 3.5(d)); correspondingly, the st<strong>and</strong>ard deviation remainsas low as 3 nm below 300 ◦ C <strong>and</strong> increases up to ≈ 7 nm at a temperature <strong>of</strong> 400 ◦ C.60Ripples periodicity [nm]50403020250 300 350 400Substrate temperature [°C]Figure 3.6: Ripples periodicity as a function <strong>of</strong> the substrate temperature during the LiFhomoepitaxy. Dashed line: linear trend <strong>of</strong> ≈ 1 nm/5 ◦ C to guide the eye.We did not consider depositions at temperatures outside the 250 ◦ C÷400 ◦ C range.However, lowering the temperature the adatoms mobility decreases <strong>and</strong> so the faceting <strong>of</strong>the (110) surfaces is harder to occur; on the contrary, at high temperature we are on oneside limited by the sample holder capabilities, on the other side the high adatoms thermalenergy is expected to gradually destroy the ripple coherence.