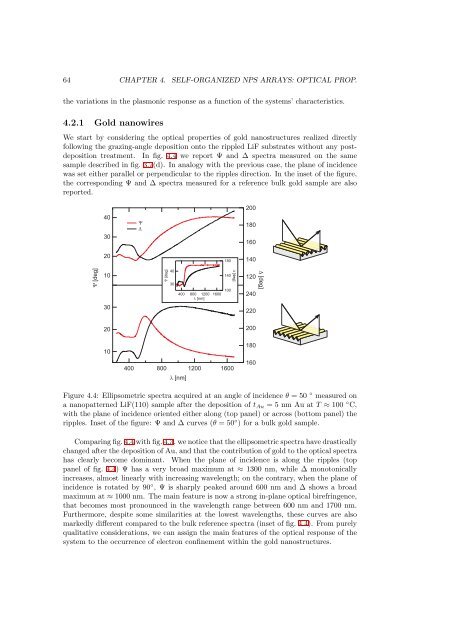
64 CHAPTER 4. SELF-ORGANIZED NPS ARRAYS: OPTICAL PROP.the variations in the <strong>plasmonic</strong> response as a function <strong>of</strong> the systems’ characteristics.4.2.1 Gold nanowiresWe start by considering the optical <strong>properties</strong> <strong>of</strong> gold nanostructures realized directlyfollowing the grazing-angle deposition onto the rippled LiF substrates without any postdepositiontreatment. In fig. 4.4 we report Ψ <strong>and</strong> ∆ spectra measured on the samesample described in fig. 3.7(d). In analogy with the previous case, the plane <strong>of</strong> incidencewas set either parallel or perpendicular to the ripples direction. In the inset <strong>of</strong> the figure,the corresponding Ψ <strong>and</strong> ∆ spectra measured for a reference bulk gold sample are alsoreported.403020018016020180140 [deg]10 [deg]4030400800 1200 [nm]1600140100 [deg]120240 [deg]302202020010180400800 [nm]12001600160Figure 4.4: Ellipsometric spectra acquired at an angle <strong>of</strong> incidence θ = 50 ◦ measured ona nanopatterned LiF(110) sample after the deposition <strong>of</strong> t Au = 5 nm Au at T ≈ 100 ◦ C,with the plane <strong>of</strong> incidence oriented either along (top panel) or across (bottom panel) theripples. Inset <strong>of</strong> the figure: Ψ <strong>and</strong> ∆ curves (θ = 50 ◦ ) for a bulk gold sample.Comparingfig.4.4withfig.4.3,wenoticethattheellipsometricspectrahavedrasticallychanged after the deposition <strong>of</strong> Au, <strong>and</strong> that the contribution <strong>of</strong> gold to the optical spectrahas clearly become dominant. When the plane <strong>of</strong> incidence is along the ripples (toppanel <strong>of</strong> fig. 4.4) Ψ has a very broad maximum at ≈ 1300 nm, while ∆ monotonicallyincreases, almost linearly with increasing wavelength; on the contrary, when the plane <strong>of</strong>incidence is rotated by 90 ◦ , Ψ is sharply peaked around 600 nm <strong>and</strong> ∆ shows a broadmaximum at ≈ 1000 nm. The main feature is now a strong in-plane optical birefringence,that becomes most pronounced in the wavelength range between 600 nm <strong>and</strong> 1700 nm.Furthermore, despite some similarities at the lowest wavelengths, these curves are alsomarkedly different compared to the bulk reference spectra (inset <strong>of</strong> fig. 4.4). From purelyqualitative considerations, we can assign the main features <strong>of</strong> the optical response <strong>of</strong> thesystem to the occurrence <strong>of</strong> electron confinement within the gold nanostructures.
4.2. OPTICAL PROPERTIES OF AU NANOPARTICLES ARRAYS 65Although spectroscopic ellipsometry is probably the most powerful optical method forthe characterization <strong>of</strong> materials, in this particular case it might not represent the moststraightforward manner to achieve a clear <strong>and</strong> simple physical picture <strong>of</strong> the phenomenaoccurring within the Au nanostructures. The onset <strong>of</strong> <strong>plasmonic</strong> response in a system is infact typically manifested with the appearance <strong>of</strong> a sharp reflectivity or absorption featureinthespectra. Whenmeasuringaratio<strong>of</strong>reflectivities, asdoneinellipsometry, suchsharpfeatures typically tend to compensate each other, thereby effectively cancelling out themost remarkable manifestation <strong>of</strong> <strong>plasmonic</strong> response. For example, the peak observedin Ψ for the plane <strong>of</strong> incidence perpendicular to the ripples (lower panel in fig. 4.4) doesnot correspond to a “true” <strong>plasmonic</strong> resonance, but simply arises as the result <strong>of</strong> theratio between the p <strong>and</strong> s reflectivities (see (1.25)). In addition to this, we also noticethat the resonances are more easily interpreted as enhancements <strong>of</strong> light reflectivity orabsorption, rather than phase variations. A more direct approach to investigate the<strong>plasmonic</strong> <strong>properties</strong> is therefore to measure separately the plain p <strong>and</strong> s reflectivities ortransmissivity, <strong>and</strong> analyse the spectra features that appear there.[110][110]spθ[110][001]sp[001] [110]a. b.Figure 4.5: Optical geometries for the reflectivity measurements, <strong>and</strong> corresponding orientations<strong>of</strong> the electric fields for either s- or p-polarized incident light. Plane <strong>of</strong> incidenceparallel (a) <strong>and</strong> perpendicular (b) to the ripples ridges.For simplicity we keep the same configurations used in the ellipsometric measurements,<strong>and</strong> we define a parallel (||) <strong>and</strong> a perpendicular (⊥) geometry for the plane <strong>of</strong> incidencerespectively parallel <strong>and</strong> perpendicular the ripples direction, as sketched in fig. 4.5 forreflection. In parallel geometry (panel (a)), when the incident light is s-polarized theelectric field is purely transverse to the ripples, oscillating in the [1¯10] direction, while forp-polarized light, it has a component both along the ripples <strong>and</strong> normal to the surface.In perpendicular (⊥) geometry (fig. 4.5(b)), instead, the system is excited purely parallel(s-polarized light) or transverse (p-polarized light) to the ripples, in the latter case simultaneouslyalong the in-plane [1¯10] <strong>and</strong> out-<strong>of</strong>-plane [110] directions. We will use thefollowing notation when referring to such reflectivities: R || P , R|| S , R⊥ P , R|| P .In fig. 4.6 we report sets <strong>of</strong> reflectivities recorded at an angle <strong>of</strong> incidence <strong>of</strong> 50 ◦ ,measured on various samples after the deposition <strong>of</strong> t Au ≈ 5 nm <strong>of</strong> gold. The blue curveswere measured on the same sample described in fig. 3.7(b), having periodicity Λ ≈ 45 nm,while the black <strong>and</strong> red ones correspond to the samples in fig. 3.7(c) (with Λ ≈ 25 nm) <strong>and</strong>in fig. 3.7(d) (with Λ ≈ 40 nm), respectively. The reflectivity <strong>of</strong> bulk gold is also reportedin fig. 4.6(c) as a reference. Furthermore, in fig. 4.7(a) we show the transmission spectrafor the sample with Λ ≈ 25 nm, corresponding to the black curves <strong>of</strong> the previous graphs.The spectra were measured at normal incidence, with light polarized either parallel (red