Morphology and plasmonic properties of self-organized arrays of ...
Morphology and plasmonic properties of self-organized arrays of ...
Morphology and plasmonic properties of self-organized arrays of ...

Create successful ePaper yourself
Turn your PDF publications into a flip-book with our unique Google optimized e-Paper software.
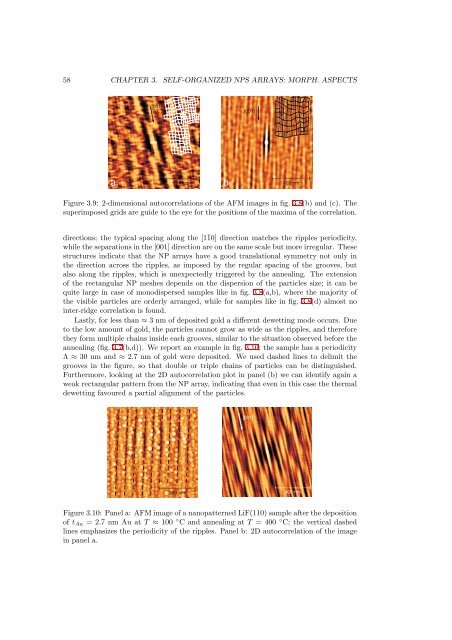
58 CHAPTER 3. SELF-ORGANIZED NPS ARRAYS: MORPH. ASPECTS[001][001]a. b.Figure 3.9: 2-dimensional autocorrelations <strong>of</strong> the AFM images in fig. 3.8(b) <strong>and</strong> (c). Thesuperimposed grids are guide to the eye for the positions <strong>of</strong> the maxima <strong>of</strong> the correlation.directions; the typical spacing along the [1¯10] direction matches the ripples periodicity,while theseparations in the[001] direction areonthesamescale butmoreirregular. Thesestructures indicate that the NP <strong>arrays</strong> have a good translational symmetry not only inthe direction across the ripples, as imposed by the regular spacing <strong>of</strong> the grooves, butalso along the ripples, which is unexpectedly triggered by the annealing. The extension<strong>of</strong> the rectangular NP meshes depends on the dispersion <strong>of</strong> the particles size; it can bequite large in case <strong>of</strong> monodispersed samples like in fig. 3.8(a,b), where the majority <strong>of</strong>the visible particles are orderly arranged, while for samples like in fig. 3.8(d) almost nointer-ridge correlation is found.Lastly, for less than ≈ 3 nm <strong>of</strong> deposited gold a different dewetting mode occurs. Dueto the low amount <strong>of</strong> gold, the particles cannot grow as wide as the ripples, <strong>and</strong> thereforethey form multiple chains inside each grooves, similar to the situation observed before theannealing (fig. 3.7(b,d)). We report an example in fig. 3.10; the sample has a periodicityΛ ≈ 30 nm <strong>and</strong> ≈ 2.7 nm <strong>of</strong> gold were deposited. We used dashed lines to delimit thegrooves in the figure, so that double or triple chains <strong>of</strong> particles can be distinguished.Furthermore, looking at the 2D autocorrelation plot in panel (b) we can identify again aweak rectangular pattern from the NP array, indicating that even in this case the thermaldewetting favoured a partial alignment <strong>of</strong> the particles.[001]Figure3.10: Panela: AFMimage<strong>of</strong>ananopatternedLiF(110)sampleafterthedeposition<strong>of</strong> t Au = 2.7 nm Au at T ≈ 100 ◦ C <strong>and</strong> annealing at T = 400 ◦ C; the vertical dashedlines emphasizes the periodicity <strong>of</strong> the ripples. Panel b: 2D autocorrelation <strong>of</strong> the imagein panel a.