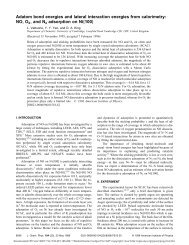
42 CHAPTER 2. EXPERIMENTAL METHODStilt/xyz manip.sampleLens60°LensViewportViewportSpectrometerXe lampPolarizerMirrorFigure 2.3: Schematic diagram <strong>of</strong> the in-situ reflectivity setup. See text for details.<strong>and</strong> ∆ values (1.25) as a function <strong>of</strong> wavelength, <strong>and</strong> <strong>of</strong>ten at several angles <strong>of</strong> incidence;usually the measurements are carried out in the visible <strong>and</strong> near-UV region, but the rangecan also be extended to near-IR. As described in §1.1.2, Ψ <strong>and</strong> ∆ represent the amplituderatio <strong>and</strong> phase variations between the p <strong>and</strong> s components <strong>of</strong> the reflected light; byconvention, they are written asρ = tanΨ e i∆ = r pr s(1.25)where r p <strong>and</strong> r s are the complex Fresnel coefficients (1.23). Separating the amplitudes<strong>and</strong> the phases, we findtanΨ = |r p||r s |∆ = δ p −δ s(2.1a)(2.1b)Lookingatthesedefinitions, wecanexpectthatthedirectinterpretation<strong>of</strong>Ψ<strong>and</strong>∆spectrais quite difficult. While certain optical features can be determined by a fast inspection<strong>of</strong> the spectra, the analysis typically requires the definition <strong>of</strong> an optical model, whichdescribes the optical constants <strong>and</strong> layer thickness <strong>of</strong> the sample, <strong>and</strong> then is employed toreproduce the experimental data. In extreme cases, one has to construct an optical modeleven when the sample structure is not clear at all. Another disadvantage, which howeverin most cases is not limiting, is the low spatial resolution <strong>of</strong> the measurement, due to thefinite spot size <strong>of</strong> the light beam, typically <strong>of</strong> few millimeters diameter.Since the first null ellipsometers [126] working at a single wavelength, several spectroscopicconfigurations have been developed, allowing the fast acquisitions <strong>of</strong> spectra over a
2.2. OPTICAL CHARACTERIZATION 43discrete range <strong>of</strong> frequencies; detailed reviews can be found in text books [126, 172, 173].Ageneralellipsometerarrangementissketchedinfig.2.4. Awell-collimated beam, comingfrom a white light source, reflects from the sample surface <strong>and</strong> is collected by a detector.Before reaching the sample, the beam passes through a polarizer, to produce controllablepolarized light, <strong>and</strong> optionally through a compensator. The sample modifies the light polarization,<strong>and</strong> a second polarizer (called analyser) is placed before the detector to selectthe polarization state to analyse. Depending on the specific configuration, the polarizer,the analyser or the compensator can be rotating.a. b.SampleRotatingCompensatorpsspAnalyzerPolarizerXe LightSourceTo the detectorFigure 2.4: Panel a: M2000-U spectroscopic ellipsometer picture. Panel b: schematicrepresentation <strong>of</strong> the M2000-U configuration.The ellipsometer used in this thesis is an M2000-U variable angle spectroscopic ellipsometerby J.A. Woollam Co., based on patented D.A.R.C.E. (Diode Array RotatingCompensator Ellipsometer) technology [178], <strong>and</strong> featuring the NIR module update. Thisinstrument works in the wavelengths range between 245 nm <strong>and</strong> 1680 nm, with a resolution<strong>of</strong> about 2 nm, <strong>and</strong> it also allows the acquisition <strong>of</strong> reflectance <strong>and</strong> transmittancespectra. As ellipsometer, it is based on a rotating compensator configuration, includinga light source, a fixed polarizer, a rotating compensator, a sample holder stage, a fixedanalyser <strong>and</strong> a detector stage (fig. 2.4).The instrument houses a 75 W Xe Arc lamp light source, emitting white unpolarizedlight in a broad continuous spectrum, from ultraviolet to near infrared. The polarizer <strong>and</strong>the analyser are two Glan-Taylor prisms [179]; for ellipsometric measurements they arefixed, while for reflectance <strong>and</strong> transmittance they can be rotated to adjust <strong>and</strong> select thepolarization <strong>of</strong> the incident <strong>and</strong> reflected beams. The compensator is a complex multielementpseudo-achromatic retarder [178]; the induced phase shift is not constant overthe measured optical range, but has a slight dependence on the wavelength, so a rigorouscalibration <strong>of</strong> retardation is provided to compensate for this error. Lastly, the detectorconsists <strong>of</strong> two spectrometers based on Diode Array technology; one <strong>of</strong> them covers thevisible range up to ≈ 1000 nm, while the second one operates in the NIR region up to≈ 1700 nm. Both the spectrometers include a dispersive optics stage, which spatiallyseparates the incoming white light beam, <strong>and</strong> a photodiode array, which collects thediffractedlight, withfewnanometers<strong>of</strong>resolution; thisallowsthesimultaneousacquisition<strong>of</strong> a total <strong>of</strong> 673 wavelengths.An example <strong>of</strong> spectroscopic ellipsometry data is reported in fig. 2.5, measured on a6 nm Au film deposited on a nanopatterned LiF(110).