Morphology and plasmonic properties of self-organized arrays of ...
Morphology and plasmonic properties of self-organized arrays of ...
Morphology and plasmonic properties of self-organized arrays of ...

You also want an ePaper? Increase the reach of your titles
YUMPU automatically turns print PDFs into web optimized ePapers that Google loves.
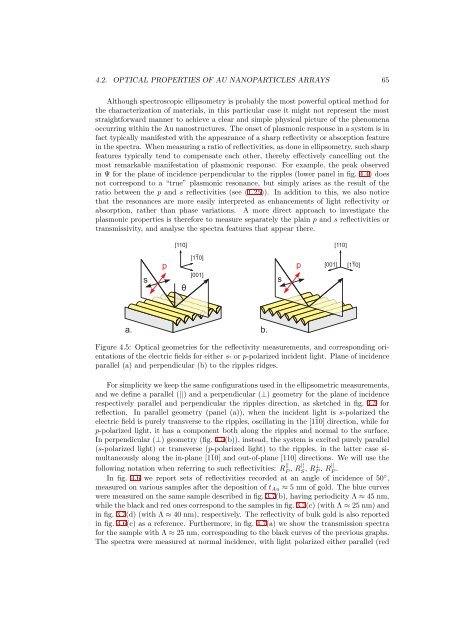
4.2. OPTICAL PROPERTIES OF AU NANOPARTICLES ARRAYS 65Although spectroscopic ellipsometry is probably the most powerful optical method forthe characterization <strong>of</strong> materials, in this particular case it might not represent the moststraightforward manner to achieve a clear <strong>and</strong> simple physical picture <strong>of</strong> the phenomenaoccurring within the Au nanostructures. The onset <strong>of</strong> <strong>plasmonic</strong> response in a system is infact typically manifested with the appearance <strong>of</strong> a sharp reflectivity or absorption featureinthespectra. Whenmeasuringaratio<strong>of</strong>reflectivities, asdoneinellipsometry, suchsharpfeatures typically tend to compensate each other, thereby effectively cancelling out themost remarkable manifestation <strong>of</strong> <strong>plasmonic</strong> response. For example, the peak observedin Ψ for the plane <strong>of</strong> incidence perpendicular to the ripples (lower panel in fig. 4.4) doesnot correspond to a “true” <strong>plasmonic</strong> resonance, but simply arises as the result <strong>of</strong> theratio between the p <strong>and</strong> s reflectivities (see (1.25)). In addition to this, we also noticethat the resonances are more easily interpreted as enhancements <strong>of</strong> light reflectivity orabsorption, rather than phase variations. A more direct approach to investigate the<strong>plasmonic</strong> <strong>properties</strong> is therefore to measure separately the plain p <strong>and</strong> s reflectivities ortransmissivity, <strong>and</strong> analyse the spectra features that appear there.[110][110]spθ[110][001]sp[001] [110]a. b.Figure 4.5: Optical geometries for the reflectivity measurements, <strong>and</strong> corresponding orientations<strong>of</strong> the electric fields for either s- or p-polarized incident light. Plane <strong>of</strong> incidenceparallel (a) <strong>and</strong> perpendicular (b) to the ripples ridges.For simplicity we keep the same configurations used in the ellipsometric measurements,<strong>and</strong> we define a parallel (||) <strong>and</strong> a perpendicular (⊥) geometry for the plane <strong>of</strong> incidencerespectively parallel <strong>and</strong> perpendicular the ripples direction, as sketched in fig. 4.5 forreflection. In parallel geometry (panel (a)), when the incident light is s-polarized theelectric field is purely transverse to the ripples, oscillating in the [1¯10] direction, while forp-polarized light, it has a component both along the ripples <strong>and</strong> normal to the surface.In perpendicular (⊥) geometry (fig. 4.5(b)), instead, the system is excited purely parallel(s-polarized light) or transverse (p-polarized light) to the ripples, in the latter case simultaneouslyalong the in-plane [1¯10] <strong>and</strong> out-<strong>of</strong>-plane [110] directions. We will use thefollowing notation when referring to such reflectivities: R || P , R|| S , R⊥ P , R|| P .In fig. 4.6 we report sets <strong>of</strong> reflectivities recorded at an angle <strong>of</strong> incidence <strong>of</strong> 50 ◦ ,measured on various samples after the deposition <strong>of</strong> t Au ≈ 5 nm <strong>of</strong> gold. The blue curveswere measured on the same sample described in fig. 3.7(b), having periodicity Λ ≈ 45 nm,while the black <strong>and</strong> red ones correspond to the samples in fig. 3.7(c) (with Λ ≈ 25 nm) <strong>and</strong>in fig. 3.7(d) (with Λ ≈ 40 nm), respectively. The reflectivity <strong>of</strong> bulk gold is also reportedin fig. 4.6(c) as a reference. Furthermore, in fig. 4.7(a) we show the transmission spectrafor the sample with Λ ≈ 25 nm, corresponding to the black curves <strong>of</strong> the previous graphs.The spectra were measured at normal incidence, with light polarized either parallel (red