Finance and Administration - Board of Trustees - The University of ...
Finance and Administration - Board of Trustees - The University of ...
Finance and Administration - Board of Trustees - The University of ...

Create successful ePaper yourself
Turn your PDF publications into a flip-book with our unique Google optimized e-Paper software.
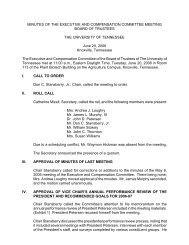
<strong>Finance</strong> <strong>and</strong> <strong>Administration</strong> Committee - VI. FY 2012 Revised Operating Budget - Action<strong>University</strong> <strong>of</strong> Tennessee SystemFY 2012 Revised Budget SummaryUnrestricted <strong>and</strong> Restricted Current Funds Revenue, Expenditures, <strong>and</strong> TransfersCHANGEFY 2011 ACTUAL FY 2012 ORIGINAL FY 2012 REVISEDOriginal To RevisedUnrestricted Restricted Total Unrestricted Restricted (1) Total Unrestricted Restricted Total Amount %EDUCATION AND GENERALRevenuesTuition & Fees $ 448,985,458$ 448,985,458 $ 488,391,964$ 488,391,964 $ 490,914,464$ 490,914,464 $ 2,522,500 0.5%State Appropriations 547,904,679 $ 21,919,553 569,824,232 411,348,082 $ 29,002,307 440,350,389 413,278,531 $ 27,067,208 440,345,739 (4,650) 0.0%Grants & Contracts 48,030,770 540,789,376 588,820,146 43,526,073 519,007,986 562,534,059 43,656,197 535,290,861 578,947,058 16,412,999 2.9%Sales & Service 53,401,514 53,401,514 50,566,561 50,566,561 51,252,652 51,252,652 686,091 1.4%Other Sources 54,598,020 62,376,346 116,974,366 51,874,695 67,793,607 119,668,302 53,760,636 63,222,763 116,983,399 (2,684,903) -2.2%Total Revenues $ 1,152,920,441 $ 625,085,275 $ 1,778,005,716 $ 1,045,707,375 $ 615,803,900 $ 1,661,511,275 $ 1,052,862,480 $ 625,580,832 $ 1,678,443,312 $ 16,932,037 1.0%4Expenditures <strong>and</strong> TransfersInstruction $ 416,108,737 $ 145,214,548 $ 561,323,285 $ 462,733,067 $ 137,571,541 $ 600,304,608 $ 470,066,999 $ 138,385,648 $ 608,452,647 $ 8,148,039 1.4%Research 71,584,378 192,326,608 263,910,986 65,755,913 175,235,404 240,991,317 92,064,457 179,074,825 271,139,282 30,147,965 12.5%Public Service 67,160,007 91,279,048 158,439,055 66,808,136 107,992,179 174,800,315 77,066,360 112,778,579 189,844,939 15,044,624 8.6%Academic Support 123,213,093 18,150,399 141,363,492 109,315,624 15,547,064 124,862,688 117,556,200 16,639,564 134,195,764 9,333,076 7.5%Student Services 76,356,504 3,421,555 79,778,059 73,023,477 1,651,242 74,674,719 76,987,083 3,521,242 80,508,325 5,833,606 7.8%Institutional Support 107,386,429 2,412,685 109,799,114 115,607,836 2,665,118 118,272,954 125,724,376 2,229,018 127,953,394 9,680,440 8.2%Operation & Maintenance <strong>of</strong> Plant 118,655,716 108,186 118,763,902 110,618,523 102,068 110,720,591 119,981,681 103,868 120,085,549 9,364,958 8.5%Scholarships & Fellowships 61,243,822 172,947,407 234,191,229 65,773,109 175,948,691 241,721,800 68,297,956 173,045,360 241,343,316 (378,484) -0.2%Sub-total Expenditures $ 1,041,708,686 $ 625,860,436 $ 1,667,569,122 $ 1,069,635,685 $ 616,713,307 $ 1,686,348,992 $ 1,147,745,112 $ 625,778,104 $ 1,773,523,216 $ 87,174,224 5.2%M<strong>and</strong>atory Transfers (In)/Out 7,226,437 7,226,437 7,208,477 7,208,477 7,223,477 7,223,477 15,000 0.2%Non-M<strong>and</strong>atory Transfers (In)/Out 93,802,280 93,802,280 (27,237,991) (27,237,991) (46,269,729) (46,269,729) (19,031,738) 69.9%Total Expenditures & Transfers $ 1,142,737,403 $ 625,860,436 $ 1,768,597,839 $ 1,049,606,171 $ 616,713,307 $ 1,666,319,478 $ 1,108,698,860 $ 625,778,104 $ 1,734,476,964 $ 68,157,486 4.1%Fund Balance Addition / (Reduction) 10,183,038 (775,161) 9,407,877 (3,898,796) (909,407) (4,808,203) (55,836,380) (197,272) (56,033,652) (51,225,449) 1065.4%AUXILIARIESRevenues $ 197,856,791 $ 745,049 $ 198,601,840 $ 197,374,326 $ 1,900,000 $ 199,274,326 $ 198,219,661 $ 1,900,000 $ 200,119,661 $ 845,335 0.4%Expenditures <strong>and</strong> TransfersExpenditures $ 141,182,612 $ 388,650 141,571,262 $ 136,121,195 $ 1,900,000 $ 138,021,195 $ 137,703,767 $ 1,900,000 $ 139,603,767 $ 1,582,572 1.1%M<strong>and</strong>atory Transfers 23,923,900 23,923,900 29,695,519 29,695,519 29,549,091 29,549,091 (146,428) -0.5%Non M<strong>and</strong>atory Transfers 31,328,086 31,328,086 31,557,612 31,557,612 30,966,803 30,966,803 (590,809) -1.9%Total Expenditures & Transfers $ 196,434,598 $ 388,650 $ 196,823,248 $ 197,374,326 $ 1,900,000 $ 199,274,326 $ 198,219,661 $ 1,900,000 $ 200,119,661 $ 845,335 0.4%Fund Balance Addition / (Reduction) 1,422,193 356,399 1,778,592 - - - - - -TOTALSRevenues $ 1,350,777,232 $ 625,830,324 $ 1,976,607,556 $ 1,243,081,701 $ 617,703,900 $ 1,860,785,601 $ 1,251,082,141 $ 627,480,832 $ 1,878,562,973 $ 17,777,372 1.0%Expenditures <strong>and</strong> TransfersExpenditures $ 1,182,891,298 $ 626,249,086 $ 1,809,140,384 $ 1,205,756,880 $ 618,613,307 $ 1,824,370,187 $ 1,285,448,879 $ 627,678,104 $ 1,913,126,983 $ 88,756,796 4.9%M<strong>and</strong>atory Transfers 31,150,337 31,150,337 36,903,996 36,903,996 36,772,568 36,772,568 (131,428) -0.4%Non M<strong>and</strong>atory Transfers 125,130,366 125,130,366 4,319,621 4,319,621 (15,302,926) (15,302,926) (19,622,547) -454.3%Total Expenditures & Transfers $ 1,339,172,001 $ 626,249,086 $ 1,965,421,087 $ 1,246,980,497 $ 618,613,307 $ 1,865,593,804 $ 1,306,918,521 $ 627,678,104 $ 1,934,596,625 $ 69,002,821 3.7%Fund Balance Addition / Reduction $ 11,605,231 $ (418,762) $ 11,186,469 $ (3,898,796) $ (909,407) $ (4,808,203) $ (55,836,380) $ (197,272) $ (56,033,652)Footnotes:1. FY12 original budget for restricted instruction <strong>and</strong> public service were reported incorrectly in the FY12 original budget document. <strong>The</strong>se have been corrected in this schedule.26Schedule 10112