<strong>Finance</strong> <strong>and</strong> <strong>Administration</strong> Committee - V. Annual Report <strong>of</strong> the Treasurer, 2011 - Informationwas established to provide fund raising support for the universityin carrying out its mission <strong>of</strong> teaching, research, <strong>and</strong> publicservice. <strong>The</strong> foundation receives contributions from individuals,corporations, alumni, <strong>and</strong> other donors.PLEDGES RECEIVABLEPledges receivable (reported as accounts, notes, <strong>and</strong> grantsreceivable on the statement <strong>of</strong> net assets) are summarized inTable 23.1 net <strong>of</strong> the allowance for doubtful accounts:Table 23.1TemporarilyRestrictedPermanentlyRestrictedCurrent pledges $ 2,466,759.29 $ 829,806.98Pledges due in 1 to 5 years 19,412,815.55 18,829,431.13Pledges due after 5 years 7,000,457.96 6,831,609.0928,880,032.80 26,490,847.20Less discounts to net present value (1,529,808.85) (1,491,124.93)Total pledges receivable, net $27,350,223.95 $24,999,722.27<strong>The</strong> allowance for doubtful accounts at June 30, 2011, was$258,263.05.INVESTMENTS AND ASSETS HELD BY THEUNIVERSITY OF TENNESSEEInvestments held at June 30, 2011, were as follows:Table 23.2Assets Held by the <strong>University</strong> <strong>of</strong>TennesseeMarket ValueCost BasisCash $ 268,894.29 $ 268,894.29U.S. equity 4,622,715.53 4,189,083.92International equity 5,990,676.96 6,622,472.03Fixed income 2,128,143.46 2,165,463.24Certificates <strong>of</strong> deposit 3,750,000.00 3,750,000.00Alternative investments:Private equity 5,446,922.24 6,124,446.99Natural resources 3,896,908.80 3,716,275.35Real estate 1,553,138.47 2,045,685.07Other alternative investments 7,340,688.67 6,386,067.73Total assets held by university 34,998,088.42 35,268,388.62Gift AnnuityCash 63,024.61 63,024.61Equities 1,252,018.35 1,137,937.46Fixed income 586,020.18 535,124.19Total gift annuity 1,901,063.14 1,736,086.26Fidelity investments 440,732.38 437,672.37Total $37,339,883.94 $37,442,147.25Also reported as investments on the statement <strong>of</strong> net assets areother gift assets totaling $7,126,640.62 <strong>and</strong> remainder interests<strong>of</strong> $18,073,544.53 as described herein.At June 30, 2011, the fair values <strong>of</strong> alternative investments arebased on valuations for which a readily determinable fair valuedoes not exist. <strong>The</strong>se investments are not listed on nationalexchanges or over-the-counter markets, <strong>and</strong> quoted marketprices are not available. <strong>The</strong> fair value <strong>of</strong> these investmentsis estimated based on a review <strong>of</strong> all available informationprovided by fund managers <strong>and</strong> general partners. <strong>The</strong>seestimates are evaluated on a regular basis <strong>and</strong> are susceptible torevisions as more information becomes available.ENDOWMENTSMost foundation endowments are invested in the <strong>University</strong> <strong>of</strong>Tennessee Consolidated Investment Pool. <strong>The</strong> endowments areinvested according to the policies <strong>of</strong> the university. Investmentpool earnings for the foundation endowments are providedto the university to be used as stipulated in the endowmentagreements. <strong>The</strong> book value <strong>and</strong> market value for theendowments invested were $31,520,571.24 <strong>and</strong> $31,250,271.04,which resulted in a cumulative unrealized loss <strong>of</strong> $270,300.20.One endowment with a market value <strong>of</strong> $440,732.38 isseparately invested. All endowments at the foundation aredonor restricted. Endowment pool earnings transferred to theuniversity were $1,323,528.46 for fiscal year 2011.<strong>The</strong> foundation has interpreted the Uniform PrudentManagement <strong>of</strong> Institutional Funds Act (UPMIFA) as requiringthe preservation <strong>of</strong> the fair value <strong>of</strong> the original gift as <strong>of</strong>the gift date <strong>of</strong> the donor-restricted endowment funds absentexplicit donor stipulations to the contrary. As a result, thefoundation classifies permanently restricted net assets as (1) theoriginal value <strong>of</strong> gifts to the endowment, (2) the original value<strong>of</strong> subsequent gifts to the endowment, (3) accumulations to theendowment made in accordance with the gift instrument, <strong>and</strong>(4) the endowment is vested in the university’s ConsolidatedInvestment Pool. Other endowments that are not classified aspermanently restricted are classified as temporarily restrictednet assets.A schedule <strong>of</strong> endowments by fund type (Table 23.3) isprovided on the following page. Due to the GASB reformatting,temporarily restricted net assets are reported as expendablerestricted net assets, <strong>and</strong> permanently restricted net assets arereported as nonexpendable restricted net assets on the statement<strong>of</strong> net assets.From time to time, the fair value <strong>of</strong> assets associated withindividual donor restricted endowment funds may fall below thelevel that the donor or UPMIFA requires the foundation to retainas a fund <strong>of</strong> perpetual duration. In accordance with GAAP,deficiencies <strong>of</strong> this nature that are reported in unrestricted netassets were $267,240.19 at June 30, 2011. <strong>The</strong>se deficienciesresulted from unfavorable market fluctuations that occurredshortly after the investment <strong>of</strong> new permanently restrictedcontributions <strong>and</strong> continued appropriation for certain programsthat were deemed prudent.33163
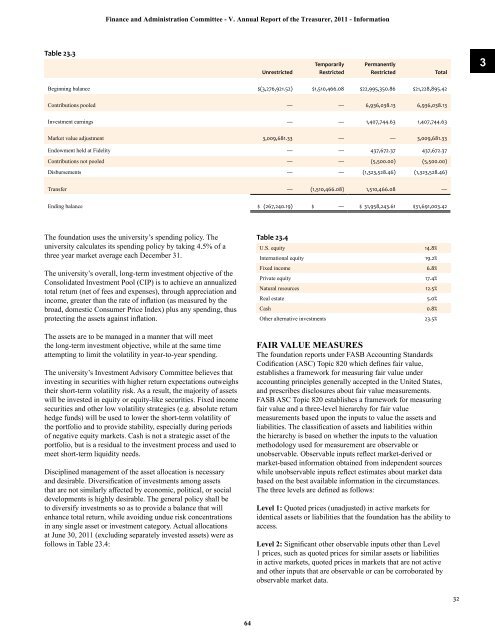
<strong>Finance</strong> <strong>and</strong> <strong>Administration</strong> Committee - V. Annual Report <strong>of</strong> the Treasurer, 2011 - InformationTable 23.3UnrestrictedTemporarilyRestrictedPermanentlyRestrictedTotal3Beginning balance $(3,276,921.52) $1,510,466.08 $22,995,350.86 $21,228,895.42Contributions pooled — — 6,936,038.13 6,936,038.13Investment earnings — — 1,407,744.63 1,407,744.63Market value adjustment 3,009,681.33 — — 3,009,681.33Endowment held at Fidelity — — 437,672.37 437,672.37Contributions not pooled — — (5,500.00) (5,500.00)Disbursements — — (1,323,528.46) (1,323,528.46)Transfer — (1,510,466.08) 1,510,466.08 —Ending balance $ (267,240.19) $ — $ 31,958,243.61 $31,691,003.42<strong>The</strong> foundation uses the university’s spending policy. <strong>The</strong>university calculates its spending policy by taking 4.5% <strong>of</strong> athree year market average each December 31.<strong>The</strong> university’s overall, long-term investment objective <strong>of</strong> theConsolidated Investment Pool (CIP) is to achieve an annualizedtotal return (net <strong>of</strong> fees <strong>and</strong> expenses), through appreciation <strong>and</strong>income, greater than the rate <strong>of</strong> inflation (as measured by thebroad, domestic Consumer Price Index) plus any spending, thusprotecting the assets against inflation.<strong>The</strong> assets are to be managed in a manner that will meetthe long-term investment objective, while at the same timeattempting to limit the volatility in year-to-year spending.<strong>The</strong> university’s Investment Advisory Committee believes thatinvesting in securities with higher return expectations outweighstheir short-term volatility risk. As a result, the majority <strong>of</strong> assetswill be invested in equity or equity-like securities. Fixed incomesecurities <strong>and</strong> other low volatility strategies (e.g. absolute returnhedge funds) will be used to lower the short-term volatility <strong>of</strong>the portfolio <strong>and</strong> to provide stability, especially during periods<strong>of</strong> negative equity markets. Cash is not a strategic asset <strong>of</strong> theportfolio, but is a residual to the investment process <strong>and</strong> used tomeet short-term liquidity needs.Disciplined management <strong>of</strong> the asset allocation is necessary<strong>and</strong> desirable. Diversification <strong>of</strong> investments among assetsthat are not similarly affected by economic, political, or socialdevelopments is highly desirable. <strong>The</strong> general policy shall beto diversify investments so as to provide a balance that willenhance total return, while avoiding undue risk concentrationsin any single asset or investment category. Actual allocationsat June 30, 2011 (excluding separately invested assets) were asfollows in Table 23.4:Table 23.4U.S. equity 14.8%International equity 19.2%Fixed income 6.8%Private equity 17.4%Natural resources 12.5%Real estate 5.0%Cash 0.8%Other alternative investments 23.5%FAIR VALUE MEASURES<strong>The</strong> foundation reports under FASB Accounting St<strong>and</strong>ardsCodification (ASC) Topic 820 which defines fair value,establishes a framework for measuring fair value underaccounting principles generally accepted in the United States,<strong>and</strong> prescribes disclosures about fair value measurements.FASB ASC Topic 820 establishes a framework for measuringfair value <strong>and</strong> a three-level hierarchy for fair valuemeasurements based upon the inputs to value the assets <strong>and</strong>liabilities. <strong>The</strong> classification <strong>of</strong> assets <strong>and</strong> liabilities withinthe hierarchy is based on whether the inputs to the valuationmethodology used for measurement are observable orunobservable. Observable inputs reflect market-derived ormarket-based information obtained from independent sourceswhile unobservable inputs reflect estimates about market databased on the best available information in the circumstances.<strong>The</strong> three levels are defined as follows:Level 1: Quoted prices (unadjusted) in active markets foridentical assets or liabilities that the foundation has the ability toaccess.Level 2: Significant other observable inputs other than Level1 prices, such as quoted prices for similar assets or liabilitiesin active markets, quoted prices in markets that are not active<strong>and</strong> other inputs that are observable or can be corroborated byobservable market data.3264