36 Drying of Wood
36 Drying of Wood
36 Drying of Wood
- No tags were found...

Create successful ePaper yourself
Turn your PDF publications into a flip-book with our unique Google optimized e-Paper software.
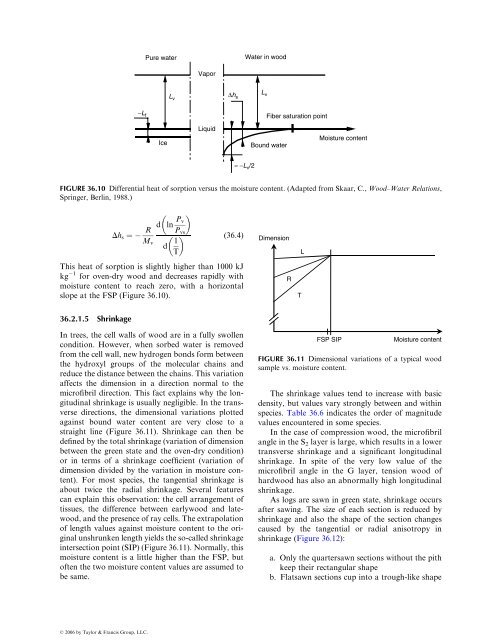
Pure waterWater in woodVaporL vΔh sL v−L fFiber saturation pointIceLiquidBound waterMoisture content≈ −L v /2FIGURE <strong>36</strong>.10 Differential heat <strong>of</strong> sorption versus the moisture content. (Adapted from Skaar, C., <strong>Wood</strong>–Water Relations,Springer, Berlin, 1988.)Dh s ¼d ln P vR P vsM vd1 (<strong>36</strong>:4)TDimensionLThis heat <strong>of</strong> sorption is slightly higher than 1000 kJkg 1 for oven-dry wood and decreases rapidly withmoisture content to reach zero, with a horizontalslope at the FSP (Figure <strong>36</strong>.10).RT<strong>36</strong>.2.1 .5 Sh rinkageIn trees, the cell walls <strong>of</strong> wood are in a fully swollencondition. However, when sorbed water is removedfrom the cell wall, new hydrogen bonds form betweenthe hydroxyl groups <strong>of</strong> the molecular chains andreduce the distance between the chains. This variationaffects the dimension in a direction normal to themicr<strong>of</strong>ibril direction. This fact explains why the longitudinalshrinkage is usually negligible. In the transversedirections, the dimensional variations plottedagainst bound water content are very close to astraight line (Figure <strong>36</strong>.11). Shrinkage can then bedefined by the total shrinkage (variation <strong>of</strong> dimensionbetween the green state and the oven-dry condition)or in terms <strong>of</strong> a shrinkage coefficient (variation <strong>of</strong>dimension divided by the variation in moisture content).For most species, the tangential shrinkage isabout twice the radial shrinkage. Several featurescan explain this observation: the cell arrangement <strong>of</strong>tissues, the difference between earlywood and latewood,and the presence <strong>of</strong> ray cells. The extrapolation<strong>of</strong> length values against moisture content to the originalunshrunken length yields the so-called shrinkageintersection point (SIP) (Figure <strong>36</strong>.11). Normally, thismoisture content is a little higher than the FSP, but<strong>of</strong>ten the two moisture content values are assumed tobe same.FSP SIPMoisture contentFIGURE <strong>36</strong>.11 Dimensional variations <strong>of</strong> a typical woodsample vs. moisture content.The shrinkage values tend to increase with basicdensity, but values vary strongly between and withinspecies. Table <strong>36</strong>.6 indicates the order <strong>of</strong> magnitudevalues encountered in some species.In the case <strong>of</strong> compression wood, the micr<strong>of</strong>ibrilangle in the S 2 layer is large, which results in a lowertransverse shrinkage and a significant longitudinalshrinkage. In spite <strong>of</strong> the very low value <strong>of</strong> themicr<strong>of</strong>ibril angle in the G layer, tension wood <strong>of</strong>hardwood has also an abnormally high longitudinalshrinkage.As logs are sawn in green state, shrinkage occursafter sawing. The size <strong>of</strong> each section is reduced byshrinkage and also the shape <strong>of</strong> the section changescaused by the tangential or radial anisotropy inshrinkage (Figure <strong>36</strong>.12):a. Only the quartersawn sections without the pithkeep their rectangular shapeb. Flatsawn sections cup into a trough-like shapeß 2006 by Taylor & Francis Group, LLC.