For the gaseous phasev g ¼For the liquid phasev ‘ ¼Kk rg(S)m grP g (<strong>36</strong> :6)Kk r‘(S)m ‘rP ‘ (<strong>36</strong> :7)The liquid pressure is related to the gaseous pressurethrough the capillary pressure function:P ‘ ¼ P g P c (S) (<strong>36</strong> :8)Equation <strong>36</strong>.6 and Equation <strong>36</strong>.7 must be consistentwith Darcy’s law (Equation <strong>36</strong>.5) when one singlefluidphase occupies the porous medium. Consequently,the relative permeability functions fulfill thefollowing conditions:Gas only Liquid onlyk r‘ (0) ¼ 0, k r‘ (1) ¼ 1k rg (0) ¼ 1, k rg (1) ¼ 0(<strong>36</strong> :9)Although depending on both initial and boundaryconditions, the relative permeability values are usuallysupposed to be the function <strong>of</strong> saturation only.Even with this simple assumption, their experimentaldetermination remains very challenging.Very few results are available in the literature forwood. Some data have been published by Tesoro et al.(1972, 1974). A recent paper by Tremblay et al. (2000)describes an indirect method to measure this property.Based on the geometrical model <strong>of</strong> tracheids proposedby Comstock (1970), Spolek and Plumb (1980)derived an expression for the relative permeability ins<strong>of</strong>twoods. This model assumes that all tracheids areexactly similar and that the wetting-phase distributionis ideal. Their final expression involves an irreduciblesaturation, below which no liquid flux is possible.This concept <strong>of</strong> irreducible saturation has beenwidely discussed, especially in the context <strong>of</strong> petroleumproduction (Dullien, 1992). Depending on theboundary conditions, one part <strong>of</strong> the fluid phasethat occupied the medium at the beginning <strong>of</strong> theexperiment remains in the medium, even though itsflow rate has vanished. This part seems to be trappedin the medium in what is called a ‘‘pendular’’ state.The amount <strong>of</strong> the residual part increases with theimbibition or drainage velocity. In addition, theamount <strong>of</strong> trapped phase after the experiment reduceswith time; surface spreading in the solid phase and theedge-capillary pressure are the two mechanisms thatcan explain this observation (Dullien, 1992). Due tothe microporosity that exists in the cell walls, suchmechanisms are likely to exist in wood also. However,the concept <strong>of</strong> irreducible saturation has led to unrealisticcomputed moisture content pr<strong>of</strong>iles duringdrying (Perré , 1987), though later modeling <strong>of</strong> s<strong>of</strong>twooddrying incorporates a similar concept successfullyas a mean to account for pit aspiration (Nijdamet al., 2000). In this case, ‘‘irreducible saturation’’corresponds to the condition when pit aspiration issufficiently advanced such that the remaining freemoisture is immobilized in isolated pockets in thewood.Based on the measurements in the longitudinaldirection reported by Tesoro et al. (1972), on thecurve computed from the tracheid model (Spolekand Plumb, 1980), and on those considerationsregarding the concept <strong>of</strong> irreducible saturation, thefollowing functions have been proposed for s<strong>of</strong>twoodsby Perré et al. (1993) (Figure <strong>36</strong>.14):In the transverse direction (radial or tangential)k T rg ¼ 1 þ (2S 3)S2 and k T r‘ ¼ S3 (<strong>36</strong>:10)In the longitudinal directionk L rg ¼ 1 þ (4S 5)S4 and k L r‘ ¼ S8 (<strong>36</strong>:11)<strong>36</strong>.2.2.3 Capillary PressureSome works can be found on the determination <strong>of</strong>capillary pressure functions in wood. Mercury porosimetryexhibits a dramatic effect <strong>of</strong> the sample thicknessin the longitudinal direction (Trénard, 1980). Forshort samples, the cell lumens are directly accessible tothe mercury; whereas for longer samples, the liquid hasto pass through the small openings, the pits that existbetween cells, clearly illustrating their bottleneckingeffect. The centrifuge method has been used successfullyby Spolek and Plumb (1981) on s<strong>of</strong>twoods and byChoong and Tesoro (1989) on various species. Todetermine the moisture content–water potential relationship<strong>of</strong> wood, Cloutier and Fortin (1991) used atension plate and a pressure plate. This is a drainagemethod and their results could easily be converted intoa classic capillary pressure function.Because certain anatomical features govern themorphology <strong>of</strong> wood pores, particular methods canbe applied to wood:. To compute a capillary pressure curve, Spolekand Plumb (1981) have developed the geometricalß 2006 by Taylor & Francis Group, LLC.
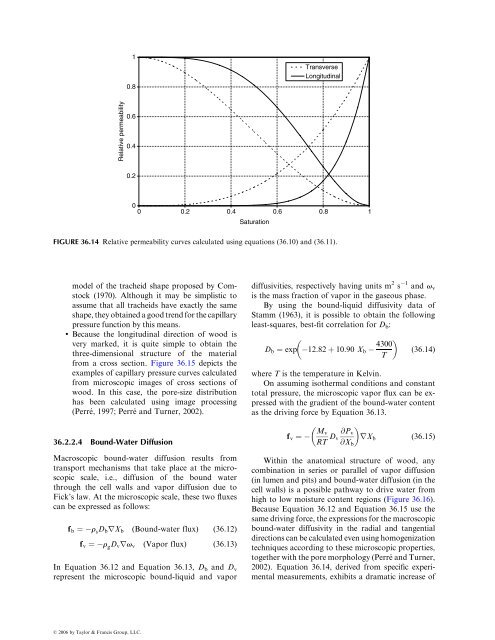
FIGURE <strong>36</strong>.14 Relative permeability curves calculated using equations (<strong>36</strong>.10) and (<strong>36</strong>.11).10.8TransverseLongitudinalRelative permeability0.60.40.200 0.2 0.4 0.6 0.8Saturation1model <strong>of</strong> the tracheid shape proposed by Comstock(1970). Although it may be simplistic toassume that all tracheids have exactly the sameshape,theyobtainedagoodtrendforthecapillarypressure function by this means.. Because the longitudinal direction <strong>of</strong> wood isvery marked, it is quite simple to obtain thethree-dimensional structure <strong>of</strong> the materialfrom a cross section. Figure <strong>36</strong>.15 depicts theexamples <strong>of</strong> capillary pressure curves calculatedfrom microscopic images <strong>of</strong> cross sections <strong>of</strong>wood. In this case, the pore-size distributionhas been calculated using image processing(Perré , 1997; Perré and Turner, 2002).<strong>36</strong>.2.2 .4 Bound -Water Diffusio nMacroscopic bound-water diffusion results fromtransport mechanisms that take place at the microscopicscale, i.e., diffusion <strong>of</strong> the bound waterthrough the cell walls and vapor diffusion due toFick’s law. At the microscopic scale, these two fluxescan be expressed as follows:f b ¼ r s D b rX b (Bound-water flux) (<strong>36</strong> :12)f v ¼ r g D v rv v (Vapor flux) (<strong>36</strong> :13)In Equation <strong>36</strong>.12 and Equation <strong>36</strong>.13, D b and D vrepresent the microscopic bound-liquid and vapordiffusivities, respectively having units m 2 s 1 and v vis the mass fraction <strong>of</strong> vapor in the gaseous phase.By using the bound-liquid diffusivity data <strong>of</strong>Stamm (1963), it is possible to obtain the followingleast-squares, best-fit correlation for D b :4300D b ¼ exp 12 :82 þ 10 :90 X b (<strong>36</strong>:14)Twhere T is the temperature in Kelvin.On assuming isothermal conditions and constanttotal pressure, the microscopic vapor flux can be expressedwith the gradient <strong>of</strong> the bound-water contentas the driving force by Equation <strong>36</strong>.13. M vf v ¼RT D @P vv rX b (<strong>36</strong>:15)@X bWithin the anatomical structure <strong>of</strong> wood, anycombination in series or parallel <strong>of</strong> vapor diffusion(in lumen and pits) and bound-water diffusion (in thecell walls) is a possible pathway to drive water fromhigh to low moisture content regions (Figure <strong>36</strong>.16).Because Equation <strong>36</strong>.12 and Equation <strong>36</strong>.15 use thesame driving force, the expressions for the macroscopicbound-water diffusivity in the radial and tangentialdirectionscanbecalculatedevenusinghomogenizationtechniques according to these microscopic properties,together with the pore morphology (Perré and Turner,2002). Equation <strong>36</strong>.14, derived from specific experimentalmeasurements, exhibits a dramatic increase <strong>of</strong>ß 2006 by Taylor & Francis Group, LLC.