SOIL Report 2011 - ACCESS Development Services
SOIL Report 2011 - ACCESS Development Services
SOIL Report 2011 - ACCESS Development Services
- No tags were found...

Create successful ePaper yourself
Turn your PDF publications into a flip-book with our unique Google optimized e-Paper software.
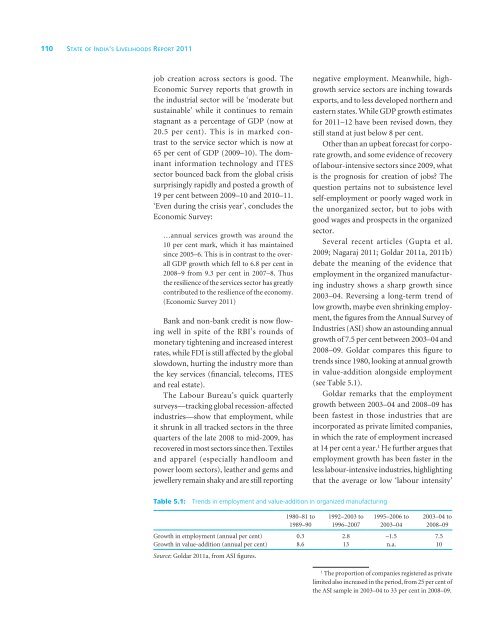
110 State of India’s Livelihoods <strong>Report</strong> <strong>2011</strong>job creation across sectors is good. TheEconomic Survey reports that growth inthe industrial sector will be ‘moderate butsustainable’ while it continues to remainstagnant as a percentage of GDP (now at20.5 per cent). This is in marked contrastto the service sector which is now at65 per cent of GDP (2009–10). The dominantinformation technology and ITESsector bounced back from the global crisissurprisingly rapidly and posted a growth of19 per cent between 2009–10 and 2010–11.‘Even during the crisis year’, concludes theEconomic Survey:…annual services growth was around the10 per cent mark, which it has maintainedsince 2005–6. This is in contrast to the overallGDP growth which fell to 6.8 per cent in2008–9 from 9.3 per cent in 2007–8. Thusthe resilience of the services sector has greatlycontributed to the resilience of the economy.(Economic Survey <strong>2011</strong>)Bank and non-bank credit is now flowingwell in spite of the RBI’s rounds ofmonetary tightening and increased interestrates, while FDI is still affected by the globalslowdown, hurting the industry more thanthe key services (financial, telecoms, ITESand real estate).The Labour Bureau’s quick quarterlysurveys—tracking global recession-affectedindustries—show that employment, whileit shrunk in all tracked sectors in the threequarters of the late 2008 to mid-2009, hasrecovered in most sectors since then. Textilesand apparel (especially handloom andpower loom sectors), leather and gems andjewellery remain shaky and are still reportingnegative employment. Meanwhile, highgrowthservice sectors are inching towardsexports, and to less developed northern andeastern states. While GDP growth estimatesfor <strong>2011</strong>–12 have been revised down, theystill stand at just below 8 per cent.Other than an upbeat forecast for corporategrowth, and some evidence of recoveryof labour-intensive sectors since 2009, whatis the prognosis for creation of jobs? Thequestion pertains not to subsistence levelself-employment or poorly waged work inthe unorganized sector, but to jobs withgood wages and prospects in the organizedsector.Several recent articles (Gupta et al.2009; Nagaraj <strong>2011</strong>; Goldar <strong>2011</strong>a, <strong>2011</strong>b)debate the meaning of the evidence thatemployment in the organized manufacturingindustry shows a sharp growth since2003–04. Reversing a long-term trend oflow growth, maybe even shrinking employment,the figures from the Annual Survey ofIndustries (ASI) show an astounding annualgrowth of 7.5 per cent between 2003–04 and2008–09. Goldar compares this figure totrends since 1980, looking at annual growthin value-addition alongside employment(see Table 5.1).Goldar remarks that the employmentgrowth between 2003–04 and 2008–09 hasbeen fastest in those industries that areincorporated as private limited companies,in which the rate of employment increasedat 14 per cent a year. 1 He further argues thatemployment growth has been faster in theless labour-intensive industries, highlightingthat the average or low ‘labour intensity’Table 5.1: Trends in employment and value-addition in organized manufacturing1980–81 to1989–901992–2003 to1996–20071995–2006 to2003–042003–04 to2008–09Growth in employment (annual per cent) 0.3 2.8 –1.5 7.5Growth in value-addition (annual per cent) 8.6 13 n.a. 10Source: Goldar <strong>2011</strong>a, from ASI figures.1The proportion of companies registered as privatelimited also increased in the period, from 25 per cent ofthe ASI sample in 2003–04 to 33 per cent in 2008–09.