SOIL Report 2011 - ACCESS Development Services
SOIL Report 2011 - ACCESS Development Services
SOIL Report 2011 - ACCESS Development Services
- No tags were found...

You also want an ePaper? Increase the reach of your titles
YUMPU automatically turns print PDFs into web optimized ePapers that Google loves.
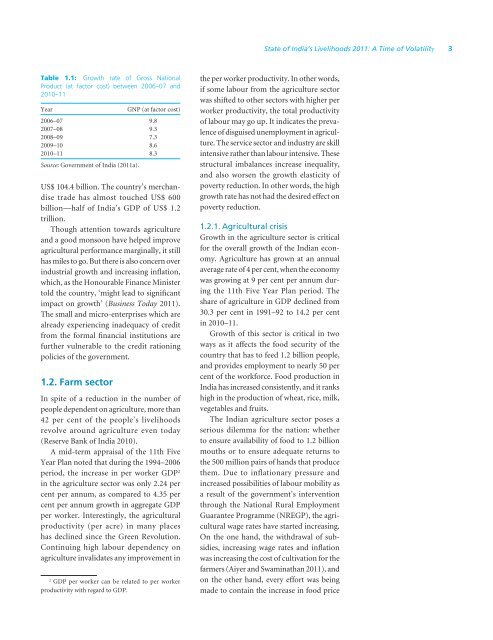
State of India’s Livelihoods <strong>2011</strong>: A Time of Volatility 3Table 1.1: Growth rate of Gross NationalProduct (at factor cost) between 2006–07 and2010–11YearGNP (at factor cost)2006–07 9.82007–08 9.32008–09 7.32009–10 8.62010–11 8.3Source: Government of India (<strong>2011</strong>a).US$ 104.4 billion. The country’s merchandisetrade has almost touched US$ 600billion—half of India’s GDP of US$ 1.2trillion.Though attention towards agricultureand a good monsoon have helped improveagricultural performance marginally, it stillhas miles to go. But there is also concern overindustrial growth and increasing inflation,which, as the Honourable Finance Ministertold the country, ‘might lead to significantimpact on growth’ (Business Today <strong>2011</strong>).The small and micro-enterprises which arealready experiencing inadequacy of creditfrom the formal financial institutions arefurther vulnerable to the credit rationingpolicies of the government.1.2. Farm sectorIn spite of a reduction in the number ofpeople dependent on agriculture, more than42 per cent of the people’s livelihoodsrevolve around agriculture even today(Reserve Bank of India 2010).A mid-term appraisal of the 11th FiveYear Plan noted that during the 1994–2006period, the increase in per worker GDP 2in the agriculture sector was only 2.24 percent per annum, as compared to 4.35 percent per annum growth in aggregate GDPper worker. Interestingly, the agriculturalproductivity (per acre) in many placeshas declined since the Green Revolution.Continuing high labour dependency onagriculture invalidates any improvement in2GDP per worker can be related to per workerproductivity with regard to GDP.the per worker productivity. In other words,if some labour from the agriculture sectorwas shifted to other sectors with higher perworker productivity, the total productivityof labour may go up. It indicates the prevalenceof disguised unemployment in agriculture.The service sector and industry are skillintensive rather than labour intensive. Thesestructural imbalances increase inequality,and also worsen the growth elasticity ofpoverty reduction. In other words, the highgrowth rate has not had the desired effect onpoverty reduction.1.2.1. Agricultural crisisGrowth in the agriculture sector is criticalfor the overall growth of the Indian economy.Agriculture has grown at an annualaverage rate of 4 per cent, when the economywas growing at 9 per cent per annum duringthe 11th Five Year Plan period. Theshare of agriculture in GDP declined from30.3 per cent in 1991–92 to 14.2 per centin 2010–11.Growth of this sector is critical in twoways as it affects the food security of thecountry that has to feed 1.2 billion people,and provides employment to nearly 50 percent of the workforce. Food production inIndia has increased consistently, and it rankshigh in the production of wheat, rice, milk,vegetables and fruits.The Indian agriculture sector poses aserious dilemma for the nation: whetherto ensure availability of food to 1.2 billionmouths or to ensure adequate returns tothe 500 million pairs of hands that producethem. Due to inflationary pressure andincreased possibilities of labour mobility asa result of the government’s interventionthrough the National Rural EmploymentGuarantee Programme (NREGP), the agriculturalwage rates have started increasing.On the one hand, the withdrawal of subsidies,increasing wage rates and inflationwas increasing the cost of cultivation for thefarmers (Aiyer and Swaminathan <strong>2011</strong>), andon the other hand, every effort was beingmade to contain the increase in food price