Livelihoods of the Poor 33home-based workers. Even in industries inwhich women work in significant numbers,less than 10 per cent are in the formal sectorof that industry. Two of the three industrieswith the fastest growth rates for womenworkers—private households and wearingapparel—are ghettoes of women labour inthe informal economy. More than threequarters (78.2 per cent) work in the leastproductive sectors of the economy, andonly a few work in modern industries withsignificantly high productivity; their numbersthere are too low to make a difference(Raveendran 2010).In sum, paid women workers in the economyget low pay, work in low productivitysectors, suffer poor working conditions,have little job security or social protection,and have no potential for improvement inskills or incomes. Little wonder then thatsome women workers have moved into sexworkto improve incomes. See Box 2.3.2.3.2. Youth 17 participationIndian economy is expected to benefit fromthe ‘demographic dividend’—the increasedproportion of young people in the workingage population. The share of youth populationincreased from 16.7 per cent in 1961Box 2.3: Entry in sex work: ‘Kaam se pet nahin bharta’ 15A pan-India survey of sex workers 16 with asample of 3,000 female and 1,355 male andtrans-persons in sex work drawn from 14states and one union territory was conductedover a period of two years (2009 and 2010).Their findings show that more than half ofthose surveyed had ‘experience of alternativework compared with those with experienceof sex work alone; 1,488 females had workedin other labour markets before entering sexwork, while 1,158 females entered sex workdirectly’.For many females, sex work was not theirfirst category of paid work. Even ‘for femaleswho started engaging in sex work in their midto lateteens, it emerged as an activity muchlater in their working life’. In the sample, thelargest category of prior work was of domesticworkers, followed by daily wage earners andthose in petty services in formal/informalestablishments.Young girls and women have left theirjobs in the informal markets for a varietyof economic reasons including ‘low pay,insufficient salary, no profit in business, noregular work, seasonal work, not gettingmoney even after work, could not run homewith that income—“is kaam se pet nahinbharta”’. The ways in which the economicreasons reinforce each other in the processof decision-making for leaving informal workand entering into sex work are as follows:• Working conditions: Hard physical workand low pay, hard work from morning toevening, had to spend a lot of time earningmoney as in the case of bidi/agarbattirolling,had to travel long distances as inthe case of wood-cutting or water-fetching,poor income plus not good for health,less rate for crafts combined with eye andbody strain in making them.• Personal or family-based reasons: Poorincome combined with parents not sendingto work after puberty, father/husbandtaking away all the money.• Migration: Shifted to dancing in UttarPradesh and Bihar for more money,migrated along with parents/husband insearch of better livelihoods.• Harassment: Poor income coupled withphysical/sexual abuse, was asked to makesex for keeping my job.15Poor income in informal sector drives majorityof sex workers into flesh trade: Survey. Available athttp://infochangeindia.org/livelihoods/books-reports/poor-income-in-informal-sector-drives-majority-ofsex-workers-into-flesh-trade-survey.html16The survey was conducted by Rohini Sahniand V. Kalyan Shankar with the assistance of severalorganizations.17The age group included in the category of youthis between 15 and 24 years of age.
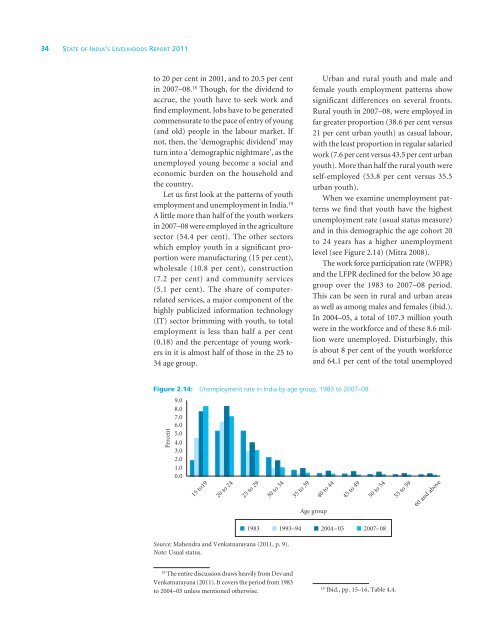
34 State of India’s Livelihoods <strong>Report</strong> <strong>2011</strong>to 20 per cent in 2001, and to 20.5 per centin 2007–08. 18 Though, for the dividend toaccrue, the youth have to seek work andfind employment. Jobs have to be generatedcommensurate to the pace of entry of young(and old) people in the labour market. Ifnot, then, the ‘demographic dividend’ mayturn into a ‘demographic nightmare’, as theunemployed young become a social andeconomic burden on the household andthe country.Let us first look at the patterns of youthemployment and unemployment in India. 19A little more than half of the youth workersin 2007–08 were employed in the agriculturesector (54.4 per cent). The other sectorswhich employ youth in a significant proportionwere manufacturing (15 per cent),wholesale (10.8 per cent), construction(7.2 per cent) and community services(5.1 per cent). The share of computerrelatedservices, a major component of thehighly publicized information technology(IT) sector brimming with youth, to totalemployment is less than half a per cent(0.18) and the percentage of young workersin it is almost half of those in the 25 to34 age group.Urban and rural youth and male andfemale youth employment patterns showsignificant differences on several fronts.Rural youth in 2007–08, were employed infar greater proportion (38.6 per cent versus21 per cent urban youth) as casual labour,with the least proportion in regular salariedwork (7.6 per cent versus 43.5 per cent urbanyouth). More than half the rural youth wereself-employed (53.8 per cent versus 35.5urban youth).When we examine unemployment patternswe find that youth have the highestunemployment rate (usual status measure)and in this demographic the age cohort 20to 24 years has a higher unemploymentlevel (see Figure 2.14) (Mitra 2008).The work force participation rate (WFPR)and the LFPR declined for the below 30 agegroup over the 1983 to 2007–08 period.This can be seen in rural and urban areasas well as among males and females (ibid.).In 2004–05, a total of 107.3 million youthwere in the workforce and of these 8.6 millionwere unemployed. Disturbingly, thisis about 8 per cent of the youth workforceand 64.1 per cent of the total unemployedFigure 2.14: Unemployment rate in India by age group, 1983 to 2007–08Source: Mahendra and Venkatnarayana (<strong>2011</strong>, p. 9).Note: Usual status.18The entire discussion draws heavily from Dev andVenkatnarayana (<strong>2011</strong>). It covers the period from 1983to 2004–05 unless mentioned otherwise.19Ibid., pp. 15–16, Table 4.4.