Livelihoods of the Poor 41(Chintan 2009 cited in Horn <strong>2011</strong>). Aworker laid off from a diamond factory inSurat captures the essence of the copingstrategy at the household level (Kapoor2009):In the earlier months we stopped consumingmilk, it is our biggest luxury and we indulgedin it uninhibitedly. We also stopped going outto eat, we used to every Sunday earlier. Wedon’t eat meat or consume alcohol [ever] butthe quality of food deteriorated just a little.I thought it was better to make these sacrificesinstead of pulling my children out of school.If they keep going to school, at least they willhave more of a chance at a better life. [Italicsin the original]In the Surat diamond industry, the rateof reverse migration was as high as 60 percent. Some migrants from Delhi also choseto return home and take up work underNREGA on a temporary basis to tide overthe crisis. Others who made a decision tostay shifted occupations—they becamepetty shop owners, vendors, rickshaw pullersand so on. A few experienced positiveoutcomes, as in Surat where one youngdiamond worker availed the skill upgradationprogramme that was offered as a specialmeasure for the unemployed workers of thediamond factories, and as a result improvedhis prospects in the industry.The uneven recovery, increasing foodinflation and increased fuel prices havemeant that families are adopting such copingstrategies—to combat the short-termpressures—which would be harmful in thelong term. An increasing number have evenbegun to withdraw children from school andput them to work. A home-based workerin Ahmedabad noted, ‘I am a widow. Myyoungest daughter was studying in fourthstandard but with the crisis I had to stop herschooling. Now she works as kitchen helperearning `5 a day’ (Horn <strong>2011</strong>). And householdscontinue to reduce food consumption,further aggravating the already high levelsof hunger and malnutrition. The next twosections examine the consequences of suchstrategies.2.5. Food inflationand hungerIndia had weathered the food crises that hadaffected the world in 2007–08 remarkablywell. But in the fourth quarter of 2008, foodinflation started to increase. Food inflation(primary and manufactured) went up from10.14 per cent in April 2009 to 16.78 inMarch 2010, led by milk (17.64 per cent)and cereal (10.74 per cent). Food inflationwas in double digits for 76 weeks from5 June 2009. In December 2009, fuelled byIndia’s worst monsoon in the past 25 years,the overall food inflation surged to a highof 22.6 per cent; primary food inflation atthe time was 20 per cent, the highest sinceNovember 1999, and inflation of manufacturedfood was 26.7 per cent.Rising food prices have disproportionatenegative consequences for the poorbecause they spend a large share of their totalexpenditure on food; and a higher numberof poor households are net buyers of staplefood rather than net sellers. The differentialimpact of food prices on households in differentclasses is evident from the consumptionexpenditures (Dev 2010). As per theNSSO 2009–10, the share of food in totalhousehold expenditure was 57 per cent and44 per cent in rural and urban India respectively.In rural India, this share in respect ofthe bottom 10 per cent of the population was65 per cent, and 46 per cent for the top 10per cent of the population. In urban India,the share of food was 62 per cent for its bottom10 per cent population and 31 per centfor the top 10 per cent population.The impact of food inflation on the pooris even higher than the one recorded by theCPI (see Box 2.5). 28 The reasons are twofold:First, the proportion of their income spenton food items is close to 60 per cent, whichis more than the index weight for food at28See n26 for details on CPI.
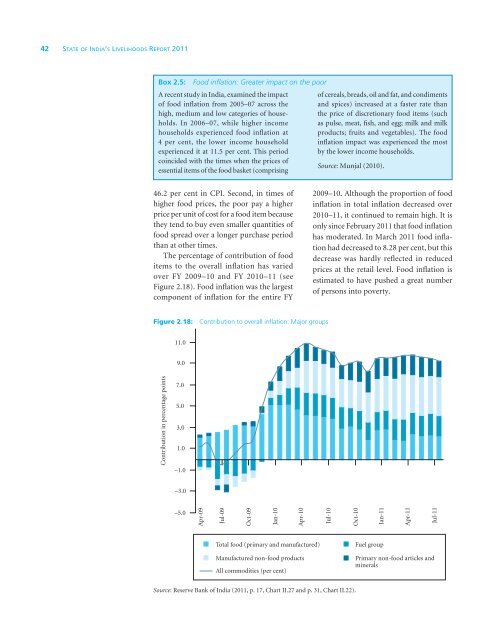
42 State of India’s Livelihoods <strong>Report</strong> <strong>2011</strong>Box 2.5: Food inflation: Greater impact on the poorA recent study in India, examined the impactof food inflation from 2005–07 across thehigh, medium and low categories of households.In 2006–07, while higher incomehouseholds experienced food inflation at4 per cent, the lower income householdexperienced it at 11.5 per cent. This periodcoincided with the times when the prices ofessential items of the food basket (comprisingof cereals, breads, oil and fat, and condimentsand spices) increased at a faster rate thanthe price of discretionary food items (suchas pulse, meat, fish, and egg; milk and milkproducts; fruits and vegetables). The foodinflation impact was experienced the mostby the lower income households.Source: Munjal (2010).46.2 per cent in CPI. Second, in times ofhigher food prices, the poor pay a higherprice per unit of cost for a food item becausethey tend to buy even smaller quantities offood spread over a longer purchase periodthan at other times.The percentage of contribution of fooditems to the overall inflation has variedover FY 2009–10 and FY 2010–11 (seeFigure 2.18). Food inflation was the largestcomponent of inflation for the entire FY2009–10. Although the proportion of foodinflation in total inflation decreased over2010–11, it continued to remain high. It isonly since February <strong>2011</strong> that food inflationhas moderated. In March <strong>2011</strong> food inflationhad decreased to 8.28 per cent, but thisdecrease was hardly reflected in reducedprices at the retail level. Food inflation isestimated to have pushed a great numberof persons into poverty.Figure 2.18: Contribution to overall inflation: Major groupsSource: Reserve Bank of India (<strong>2011</strong>, p. 17, Chart II.27 and p. 31, Chart II.22).