SOIL Report 2011 - ACCESS Development Services
SOIL Report 2011 - ACCESS Development Services
SOIL Report 2011 - ACCESS Development Services
- No tags were found...

Create successful ePaper yourself
Turn your PDF publications into a flip-book with our unique Google optimized e-Paper software.
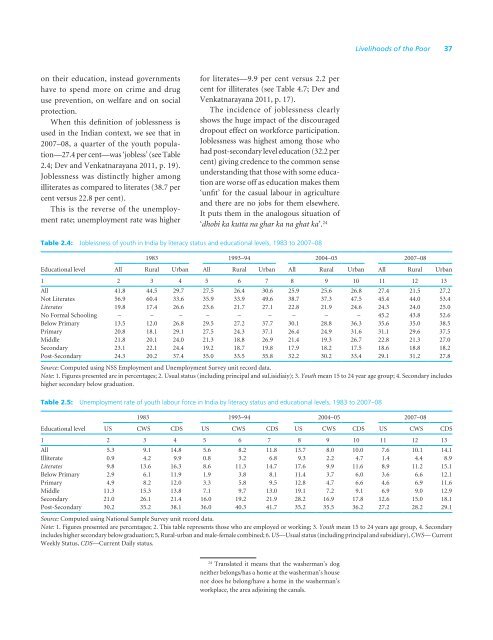
Livelihoods of the Poor 37on their education, instead governmentshave to spend more on crime and druguse prevention, on welfare and on socialprotection.When this definition of joblessness isused in the Indian context, we see that in2007–08, a quarter of the youth population—27.4per cent—was ‘jobless’ (see Table2.4; Dev and Venkatnarayana <strong>2011</strong>, p. 19).Joblessness was distinctly higher amongilliterates as compared to literates (38.7 percent versus 22.8 per cent).This is the reverse of the unemploymentrate; unemployment rate was higherfor literates—9.9 per cent versus 2.2 percent for illiterates (see Table 4.7; Dev andVenkatnarayana <strong>2011</strong>, p. 17).The incidence of joblessness clearlyshows the huge impact of the discourageddropout effect on workforce participation.Joblessness was highest among those whohad post-secondary level education (32.2 percent) giving credence to the common senseunderstanding that those with some educationare worse off as education makes them‘unfit’ for the casual labour in agricultureand there are no jobs for them elsewhere.It puts them in the analogous situation of‘dhobi ka kutta na ghar ka na ghat ka’. 24Table 2.4: Joblessness of youth in India by literacy status and educational levels, 1983 to 2007–08Educational level1983 1993–94 2004–05 2007–08All Rural Urban All Rural Urban All Rural Urban All Rural Urban1 2 3 4 5 6 7 8 9 10 11 12 13All 41.8 44.5 29.7 27.5 26.4 30.6 25.9 25.6 26.8 27.4 21.5 27.2Not Literates 56.9 60.4 33.6 35.9 33.9 49.6 38.7 37.3 47.5 45.4 44.0 53.4Literates 19.8 17.4 26.6 23.6 21.7 27.1 22.8 21.9 24.6 24.3 24.0 25.0No Formal Schooling – – – – – – – – – 45.2 43.8 52.6Below Primary 13.5 12.0 26.8 29.5 27.2 37.7 30.1 28.8 36.3 35.6 35.0 38.5Primary 20.8 18.1 29.1 27.5 24.3 37.1 26.4 24.9 31.6 31.1 29.6 37.5Middle 21.8 20.1 24.0 21.3 18.8 26.9 21.4 19.3 26.7 22.8 21.3 27.0Secondary 23.1 22.1 24.4 19.2 18.7 19.8 17.9 18.2 17.5 18.6 18.8 18.2Post-Secondary 24.3 20.2 37.4 35.0 33.5 35.8 32.2 30.2 33.4 29.1 31.2 27.8Source: Computed using NSS Employment and Unemployment Survey unit record data.Note: 1. Figures presented are in percentages; 2. Usual status (including principal and suLisidiaiy); 3. Youth mean 15 to 24 year age group; 4. Secondary includeshigher secondary below graduation.Table 2.5: Unemployment rate of youth labour force in India by literacy status and educational levels, 1983 to 2007–081983 1993–94 2004–05 2007–08Educational level US CWS CDS US CWS CDS US CWS CDS US CWS CDS1 2 3 4 5 6 7 8 9 10 11 12 13All 5.3 9.1 14.8 5.6 8.2 11.8 13.7 8.0 10.0 7.6 10.1 14.1Illiterate 0.9 4.2 9.9 0.8 3.2 6.8 9.3 2.2 4.7 1.4 4.4 8.9Literates 9.8 13.6 16.3 8.6 11.3 14.7 17.6 9.9 11.6 8.9 11.2 15.1Below Primary 2.9 6.1 11.9 1.9 3.8 8.1 11.4 3.7 6.0 3.6 6.6 12.1Primary 4.9 8.2 12.0 3.3 5.8 9.5 12.8 4.7 6.6 4.6 6.9 11.6Middle 11.3 15.3 13.8 7.1 9.7 13.0 19.1 7.2 9.1 6.9 9.0 12.9Secondary 21.0 26.1 21.4 16.0 19.2 21.9 28.2 16.9 17.8 12.6 15.0 18.1Post-Secondary 30.2 35.2 38.1 36.0 40.3 41.7 35.2 35.5 36.2 27.2 28.2 29.1Source: Computed using National Sample Survey unit record data.Note: 1. Figures presented are percentages; 2. This table represents those who are employed or working; 3. Youth mean 15 to 24 years age group, 4. Secondaryincludes higher secondary below graduation; 5, Rural-urban and male-female combined; 6. US—Usual status (including principal and subsidiary), CWS— CurrentWeekly Status, CDS—Current Daily status.24Translated it means that the washerman’s dogneither belongs/has a home at the washerman’s housenor does he belong/have a home in the washerman’sworkplace, the area adjoining the canals.