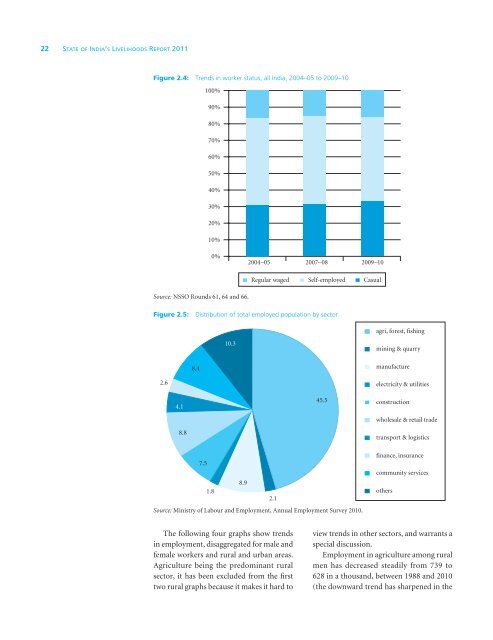
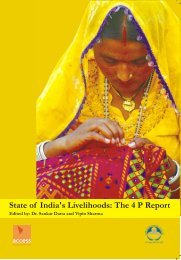
Livelihoods of the Poor 21significantly more for urban men. Regularemployment has increased marginally forboth categories. Casual employment forboth male and female workers has increasedto a greater extent. Specifically for the agecohort 25 to 59 years for all of India, therewere around 18.2 million more casual workers,compared to 6.4 million additionalregular workers and 4 million more selfemployed.Overall, self-employment continuedto be the most common form of employment;51 per cent of the labour force wasself-employed (as compared to 52.4 percent in 2004–05). Of the rest one-third(33.5 per cent) work as casual labour (increasedfrom 31.1 per cent in 2004–05) and15.6 per cent work in regular wage/salariedjobs (decreased from 16.5 in 2004–05).These numbers though hide the rural–urbandisparities.In urban areas an almost equal numberof the employed are in regular/salariedemployment and in self-employment(41.1 per cent and 41.4 per cent respectively).Less than one-fifth (17.5 per cent)were employed in casual labour; whereas,in rural areas a large percentage is employedin casual labour (38.6 per cent). Also, morethan half (54.2 per cent) of the rural workersare self-employed and only 7.3 per centare regular wage/salaried employees. Thisclearly shows the fragility of the majority ofrural livelihoods.Finally, the unemployment rate hasdecreased (from 8.82 per cent in 2004–05to 6.6 per cent in 2009–10). But the juryis still out on its meaning as this decreasehas occurred in a period of low aggregatejob creation and a decline of 2.8 per cent inworkforce participation.To summarize, the labour market trendson worker status, casual employment , themost vulnerable form of employment, hasshot up 2.5 per cent as a share of total inthe last two years, while self-employmenthas declined by the same amount, bringingit down to around 2004–05 levels.Meanwhile, regular employment has maintainedthe same proportion. The differencesin employment patterns of the ruraland urban areas have become even morepronounced. Overall, India’s economicgrowth is having spectacularly little effecton the status of the workers across the threeemployment categories of self-employed,casual and regular. Figure 2.4 shows thisfor all workers since 2004.2.2.2. Sectoral shiftsThe most recent data sources on distributionof workers by sector are the NSSO’s 66thRound and also the new annual survey bythe Ministry of Labour and Employment(2010). The latter gives the following distributionfor total employed population (ruraland urban together).Figure 2.5 shows that in 2010, 45.5 percent of all employed persons were primarilyengaged in agriculture, 8.9 per cent workedin manufacturing, a further 8.8 per cent intrade, 8.4 per cent in community services(including health and education) and 7.5 percent in construction. NSSO 66th Roundshows that 63 per cent of rural male workerswere engaged in agriculture and theremainder were distributed evenly acrossthe secondary (19 per cent) and tertiary(18 per cent) sectors. 6 In urban areas, thetertiary sector provided employment to59 per cent male workers and 53 per centfemale workers, while the secondary sectoremployed 35 per cent of male and 33 percent of female workers.NSSO data permits us to review trends insectoral employment over 22 years (1988–2010), disaggregated for rural, urban, malesand females. This gives a better insight intoemployment prospects, since we can viewthe shifts from one kind of employment toanother.6The primary sector includes agriculture, animalhusbandry, fishing, mining, forestry and so on. Thesecondary sector includes manufacturing, constructionand utilities while the tertiary sector includes trade,transport, hotels, social and business services and publicadministration.
22 State of India’s Livelihoods <strong>Report</strong> <strong>2011</strong>Figure 2.4: Trends in worker status, all India, 2004–05 to 2009–10Source: NSSO Rounds 61, 64 and 66.Figure 2.5: Distribution of total employed population by sectorSource: Ministry of Labour and Employment, Annual Employment Survey 2010.The following four graphs show trendsin employment, disaggregated for male andfemale workers and rural and urban areas.Agriculture being the predominant ruralsector, it has been excluded from the firsttwo rural graphs because it makes it hard toview trends in other sectors, and warrants aspecial discussion.Employment in agriculture among ruralmen has decreased steadily from 739 to628 in a thousand, between 1988 and 2010(the downward trend has sharpened in the