SOIL Report 2011 - ACCESS Development Services
SOIL Report 2011 - ACCESS Development Services
SOIL Report 2011 - ACCESS Development Services
- No tags were found...

You also want an ePaper? Increase the reach of your titles
YUMPU automatically turns print PDFs into web optimized ePapers that Google loves.
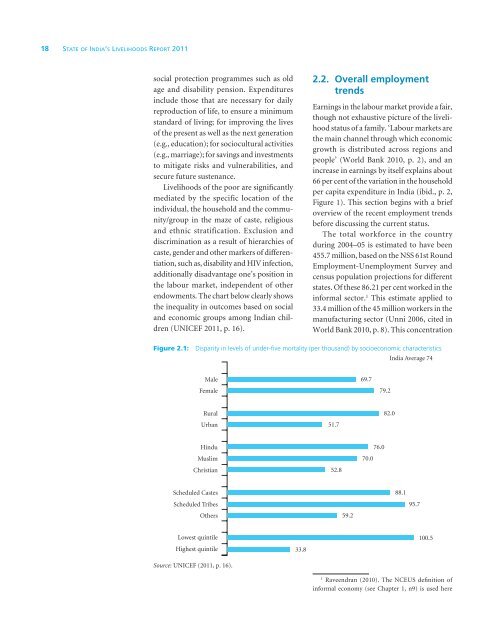
18 State of India’s Livelihoods <strong>Report</strong> <strong>2011</strong>social protection programmes such as oldage and disability pension. Expendituresinclude those that are necessary for dailyreproduction of life, to ensure a minimumstandard of living; for improving the livesof the present as well as the next generation(e.g., education); for sociocultural activities(e.g., marriage); for savings and investmentsto mitigate risks and vulnerabilities, andsecure future sustenance.Livelihoods of the poor are significantlymediated by the specific location of theindividual, the household and the community/groupin the maze of caste, religiousand ethnic stratification. Exclusion anddiscrimination as a result of hierarchies ofcaste, gender and other markers of differentiation,such as, disability and HIV infection,additionally disadvantage one’s position inthe labour market, independent of otherendowments. The chart below clearly showsthe inequality in outcomes based on socialand economic groups among Indian children(UNICEF <strong>2011</strong>, p. 16).2.2. Overall employmenttrendsEarnings in the labour market provide a fair,though not exhaustive picture of the livelihoodstatus of a family. ‘Labour markets arethe main channel through which economicgrowth is distributed across regions andpeople’ (World Bank 2010, p. 2), and anincrease in earnings by itself explains about66 per cent of the variation in the householdper capita expenditure in India (ibid., p. 2,Figure 1). This section begins with a briefoverview of the recent employment trendsbefore discussing the current status.The total workforce in the countryduring 2004–05 is estimated to have been455.7 million, based on the NSS 61st RoundEmployment-Unemployment Survey andcensus population projections for differentstates. Of these 86.21 per cent worked in theinformal sector. 1 This estimate applied to33.4 million of the 45 million workers in themanufacturing sector (Unni 2006, cited inWorld Bank 2010, p. 8). This concentrationFigure 2.1: Disparity in levels of under-five mortality (per thousand) by socioeconomic characteristicsSource: UNICEF (<strong>2011</strong>, p. 16).1Raveendran (2010). The NCEUS definition ofinformal economy (see Chapter 1, n9) is used here