SOIL Report 2011 - ACCESS Development Services
SOIL Report 2011 - ACCESS Development Services
SOIL Report 2011 - ACCESS Development Services
- No tags were found...

You also want an ePaper? Increase the reach of your titles
YUMPU automatically turns print PDFs into web optimized ePapers that Google loves.
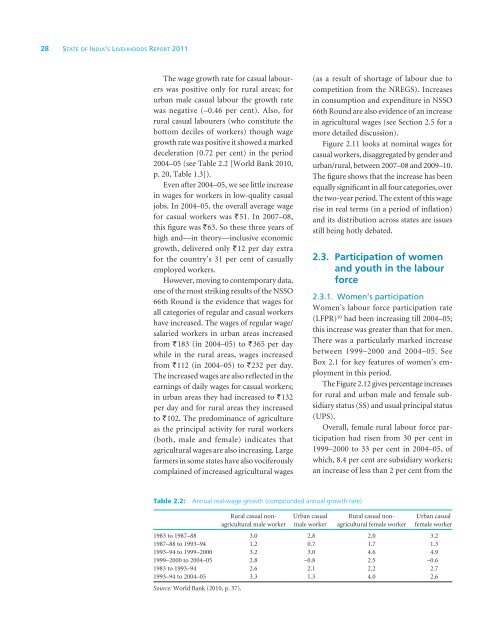
28 State of India’s Livelihoods <strong>Report</strong> <strong>2011</strong>The wage growth rate for casual labourerswas positive only for rural areas; forurban male casual labour the growth ratewas negative (–0.46 per cent). Also, forrural casual labourers (who constitute thebottom deciles of workers) though wagegrowth rate was positive it showed a markeddeceleration (0.72 per cent) in the period2004–05 (see Table 2.2 [World Bank 2010,p. 20, Table 1.3]).Even after 2004–05, we see little increasein wages for workers in low-quality casualjobs. In 2004–05, the overall average wagefor casual workers was `51. In 2007–08,this figure was `63. So these three years ofhigh and—in theory—inclusive economicgrowth, delivered only `12 per day extrafor the country’s 31 per cent of casuallyemployed workers.However, moving to contemporary data,one of the most striking results of the NSSO66th Round is the evidence that wages forall categories of regular and casual workershave increased. The wages of regular wage/salaried workers in urban areas increasedfrom `183 (in 2004–05) to `365 per daywhile in the rural areas, wages increasedfrom `112 (in 2004–05) to `232 per day.The increased wages are also reflected in theearnings of daily wages for casual workers;in urban areas they had increased to `132per day and for rural areas they increasedto `102. The predominance of agricultureas the principal activity for rural workers(both, male and female) indicates thatagricultural wages are also increasing. Largefarmers in some states have also vociferouslycomplained of increased agricultural wages(as a result of shortage of labour due tocompetition from the NREGS). Increasesin consumption and expenditure in NSSO66th Round are also evidence of an increasein agricultural wages (see Section 2.5 for amore detailed discussion).Figure 2.11 looks at nominal wages forcasual workers, disaggregated by gender andurban/rural, between 2007–08 and 2009–10.The figure shows that the increase has beenequally significant in all four categories, overthe two-year period. The extent of this wagerise in real terms (in a period of inflation)and its distribution across states are issuesstill being hotly debated.2.3. Participation of womenand youth in the labourforce2.3.1. Women’s participationWomen’s labour force participation rate(LFPR) 10 had been increasing till 2004–05;this increase was greater than that for men.There was a particularly marked increasebetween 1999–2000 and 2004–05. SeeBox 2.1 for key features of women’s employmentin this period.The Figure 2.12 gives percentage increasesfor rural and urban male and female subsidiarystatus (SS) and usual principal status(UPS).Overall, female rural labour force participationhad risen from 30 per cent in1999–2000 to 33 per cent in 2004–05, ofwhich, 8.4 per cent are subsidiary workers;an increase of less than 2 per cent from theTable 2.2: Annual real-wage growth (compounded annual growth rate)Rural casual nonagriculturalmale workerUrban casualmale workerRural casual nonagriculturalfemale workerUrban casualfemale worker1983 to 1987–88 3.0 2.8 2.0 3.21987–88 to 1993–94 1.2 0.7 1.7 1.31993–94 to 1999–2000 3.2 3.0 4.6 4.91999–2000 to 2004–05 2.8 –0.8 2.5 –0.61983 to 1993–94 2.6 2.1 2.2 2.71993–94 to 2004–05 3.3 1.3 4.0 2.6Source: World Bank (2010, p. 37).