Winter 2008 - Vol. 3 No. 3 - National Association of Extension 4-H ...
Winter 2008 - Vol. 3 No. 3 - National Association of Extension 4-H ...
Winter 2008 - Vol. 3 No. 3 - National Association of Extension 4-H ...
- No tags were found...

You also want an ePaper? Increase the reach of your titles
YUMPU automatically turns print PDFs into web optimized ePapers that Google loves.
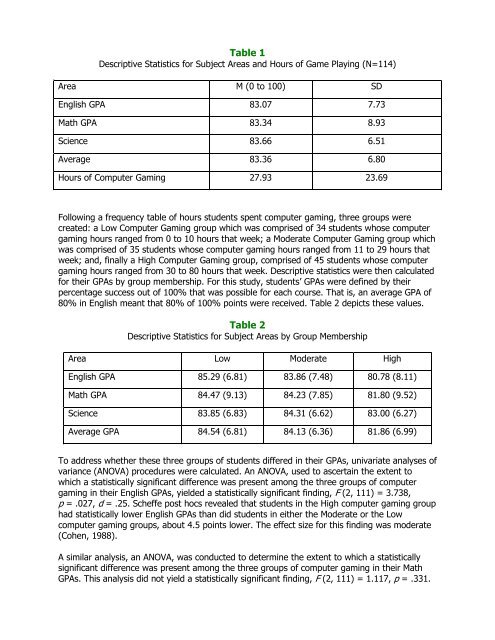
Table 1Descriptive Statistics for Subject Areas and Hours <strong>of</strong> Game Playing (N=114)Area M (0 to 100) SDEnglish GPA 83.07 7.73Math GPA 83.34 8.93Science 83.66 6.51Average 83.36 6.80Hours <strong>of</strong> Computer Gaming 27.93 23.69Following a frequency table <strong>of</strong> hours students spent computer gaming, three groups werecreated: a Low Computer Gaming group which was comprised <strong>of</strong> 34 students whose computergaming hours ranged from 0 to 10 hours that week; a Moderate Computer Gaming group whichwas comprised <strong>of</strong> 35 students whose computer gaming hours ranged from 11 to 29 hours thatweek; and, finally a High Computer Gaming group, comprised <strong>of</strong> 45 students whose computergaming hours ranged from 30 to 80 hours that week. Descriptive statistics were then calculatedfor their GPAs by group membership. For this study, students’ GPAs were defined by theirpercentage success out <strong>of</strong> 100% that was possible for each course. That is, an average GPA <strong>of</strong>80% in English meant that 80% <strong>of</strong> 100% points were received. Table 2 depicts these values.Table 2Descriptive Statistics for Subject Areas by Group MembershipArea Low Moderate HighEnglish GPA 85.29 (6.81) 83.86 (7.48) 80.78 (8.11)Math GPA 84.47 (9.13) 84.23 (7.85) 81.80 (9.52)Science 83.85 (6.83) 84.31 (6.62) 83.00 (6.27)Average GPA 84.54 (6.81) 84.13 (6.36) 81.86 (6.99)To address whether these three groups <strong>of</strong> students differed in their GPAs, univariate analyses <strong>of</strong>variance (ANOVA) procedures were calculated. An ANOVA, used to ascertain the extent towhich a statistically significant difference was present among the three groups <strong>of</strong> computergaming in their English GPAs, yielded a statistically significant finding, F (2, 111) = 3.738,p = .027, d = .25. Scheffe post hocs revealed that students in the High computer gaming grouphad statistically lower English GPAs than did students in either the Moderate or the Lowcomputer gaming groups, about 4.5 points lower. The effect size for this finding was moderate(Cohen, 1988).A similar analysis, an ANOVA, was conducted to determine the extent to which a statisticallysignificant difference was present among the three groups <strong>of</strong> computer gaming in their MathGPAs. This analysis did not yield a statistically significant finding, F (2, 111) = 1.117, p = .331.