Download Report - UNDP Asia-Pacific Regional Centre - United ...
Download Report - UNDP Asia-Pacific Regional Centre - United ...
Download Report - UNDP Asia-Pacific Regional Centre - United ...

You also want an ePaper? Increase the reach of your titles
YUMPU automatically turns print PDFs into web optimized ePapers that Google loves.
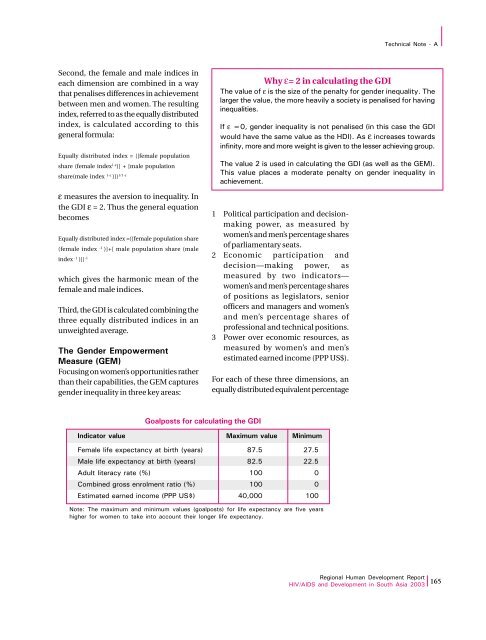
Technical Note - ASecond, the female and male indices ineach dimension are combined in a waythat penalises differences in achievementbetween men and women. The resultingindex, referred to as the equally distributedindex, is calculated according to thisgeneral formula:Equally distributed index = {[female populationshare (female index 1-ε )] + [male populationshare(male index 1-ε )]} 1/1-εε measures the aversion to inequality. Inthe GDI ε = 2. Thus the general equationbecomesEqually distributed index ={[female population share(female index -1 )]+[ male population share (maleindex -1 )]} -1which gives the harmonic mean of thefemale and male indices.Third, the GDI is calculated combining thethree equally distributed indices in anunweighted average.The Gender EmpowermentMeasure (GEM)Focusing on women’s opportunities ratherthan their capabilities, the GEM capturesgender inequality in three key areas:Why ε= 2 in calculating the GDIThe value of ε is the size of the penalty for gender inequality. Thelarger the value, the more heavily a society is penalised for havinginequalities.If ε =0, gender inequality is not penalised (in this case the GDIwould have the same value as the HDI). As ε increases towardsinfinity, more and more weight is given to the lesser achieving group.The value 2 is used in calculating the GDI (as well as the GEM).This value places a moderate penalty on gender inequality inachievement.1 Political participation and decisionmakingpower, as measured bywomen’s and men’s percentage sharesof parliamentary seats.2 Economic participation anddecision—making power, asmeasured by two indicators—women’s and men’s percentage sharesof positions as legislators, seniorofficers and managers and women’sand men’s percentage shares ofprofessional and technical positions.3 Power over economic resources, asmeasured by women’s and men’sestimated earned income (PPP US$).For each of these three dimensions, anequally distributed equivalent percentageGoalposts for calculating the GDIIndicator value Maximum value Minimumemale life expectancy at birth (years) 87.5 27.5Male life expectancy at birth (years) 82.5 22.5Adult literacy rate (%) 100 0Combined gross enrolment ratio (%) 100 0Estimated earned income (PPP US$) 40,000 100Note: The maximum and minimum values (goalposts) for life expectancy are five yearshigher for women to take into account their longer life expectancy.<strong>Regional</strong> Human Development <strong>Report</strong>HIV/AIDS and Development in South <strong>Asia</strong> 2003 165