- Page 1 and 2:
It is now well accepted that HIV/AI
- Page 3 and 4:
© United Nations Development Progr
- Page 5 and 6:
OverviewGlobally, the Human Develop
- Page 7 and 8:
AcknowledgementsCombating HIV/AIDS
- Page 9 and 10:
The TeamHDRC: K. Seeta Prabhu, Sura
- Page 11 and 12:
ContentsCHAPTER 1Introduction1.1 Th
- Page 13 and 14:
Contents3.2 African AIDS is not a s
- Page 15 and 16:
GlossaryAIDSAcquired Immuno-deficie
- Page 19 and 20:
Introduction2Regional Human Develop
- Page 21 and 22:
Introductioncases, the region has t
- Page 23 and 24:
IntroductionAlthough theHIV/AIDS in
- Page 25 and 26:
IntroductionBox 1.2Human developmen
- Page 27 and 28:
IntroductionBox 1.3Millennium Devel
- Page 31 and 32:
Nexus between Human Development and
- Page 33 and 34:
Nexus between Human Development and
- Page 35 and 36:
Nexus between Human Development and
- Page 37 and 38:
Nexus between Human Development and
- Page 39 and 40:
Nexus between Human Development and
- Page 41 and 42:
Nexus between Human Development and
- Page 43 and 44:
Nexus between Human Development and
- Page 45 and 46:
Nexus between Human Development and
- Page 47 and 48:
Nexus between Human Development and
- Page 49 and 50:
Nexus between Human Development and
- Page 51 and 52:
Nexus between Human Development and
- Page 53 and 54:
Nexus between Human Development and
- Page 55 and 56:
Nexus between Human Development and
- Page 57 and 58:
The HIV/AIDS Epidemics of South Asi
- Page 59 and 60:
The HIV/AIDS Epidemics of South Asi
- Page 61 and 62:
The HIV/AIDS Epidemics of South Asi
- Page 63 and 64:
The HIV/AIDS Epidemics of South Asi
- Page 65 and 66:
The HIV/AIDS Epidemics of South Asi
- Page 67 and 68:
The HIV/AIDS Epidemics of South Asi
- Page 69 and 70:
The HIV/AIDS Epidemics of South Asi
- Page 71 and 72:
The HIV/AIDS Epidemics of South Asi
- Page 73 and 74:
The HIV/AIDS Epidemics of South Asi
- Page 75 and 76:
The HIV/AIDS Epidemics of South Asi
- Page 77 and 78:
The HIV/AIDS Epidemics of South Asi
- Page 79 and 80:
The HIV/AIDS Epidemics of South Asi
- Page 81 and 82:
The HIV/AIDS Epidemics of South Asi
- Page 83 and 84:
The HIV/AIDS Epidemics of South Asi
- Page 85 and 86:
The HIV/AIDS Epidemics of South Asi
- Page 87:
The HIV/AIDS Epidemics of South Asi
- Page 90 and 91:
Human Rights and HIV/AIDS“An impo
- Page 92 and 93:
Human Rights and HIV/AIDSincrease t
- Page 94 and 95:
Human Rights and HIV/AIDSsupport an
- Page 96 and 97:
Human Rights and HIV/AIDSBox 4.3Sti
- Page 98 and 99:
Human Rights and HIV/AIDSBox 4.5Bad
- Page 100 and 101:
Human Rights and HIV/AIDSnumber of
- Page 102 and 103:
Human Rights and HIV/AIDSnegotiate
- Page 104 and 105:
Human Rights and HIV/AIDSBox 4.6Ind
- Page 106 and 107:
Human Rights and HIV/AIDSTable 4.2I
- Page 108 and 109:
Human Rights and HIV/AIDSsociety in
- Page 110 and 111:
Human Rights and HIV/AIDSReforms co
- Page 112 and 113:
Human Rights and HIV/AIDSSource: WH
- Page 114 and 115:
Human Rights and HIV/AIDSBox 4.12Me
- Page 116 and 117:
Human Rights and HIV/AIDSclients an
- Page 118 and 119:
Human Rights and HIV/AIDSand develo
- Page 120 and 121:
Human Rights and HIV/AIDSparticular
- Page 122 and 123:
Human Rights and HIV/AIDSTable 4.5S
- Page 124 and 125:
Human Rights and HIV/AIDSBox 4.16Th
- Page 126 and 127:
Human Rights and HIV/AIDSBox 4.17Hu
- Page 128 and 129:
Human Rights and HIV/AIDSnuisance.
- Page 130 and 131:
Human Rights and HIV/AIDSand autono
- Page 132 and 133:
The Way orwardRegional Human Develo
- Page 134 and 135: The Way orward“The social andpoli
- Page 136 and 137: The Way orwardis not a desirable on
- Page 138 and 139: The Way orwarddevelopment, divert s
- Page 140 and 141: The Way orwardProviding ARV treatme
- Page 142 and 143: The Way orward5.5 Adolescent Sexual
- Page 144 and 145: The Way orwardwomen’s lives are t
- Page 146 and 147: The Way orwardcomprehensive guidanc
- Page 148 and 149: The Way orwardInvolving religious l
- Page 150 and 151: The Way orwardconcerns and extended
- Page 152 and 153: The Way orwardlInvolvement of gover
- Page 154: The Way orwardfor people who are an
- Page 157 and 158: Endnotes17 Bandhu, 200218 UNAIDS/WH
- Page 159 and 160: Endnotes56 Pradhan, 199857 Malla, 2
- Page 161 and 162: Endnoteson Economic, Social and Cul
- Page 163 and 164: Annexure IRegional Human Developmen
- Page 165 and 166: Annexure ICountry Treaty Concluding
- Page 167 and 168: Annexure IAnnexure IIInternational
- Page 169 and 170: Technical Note - ATechnical Note -
- Page 171 and 172: Technical Note - A(EDEP) is calcula
- Page 173 and 174: Technical Note - Bvalue is to the u
- Page 175 and 176: Technical Note - Bsubstantial degre
- Page 177 and 178: Technical Note - Bthe rate of growt
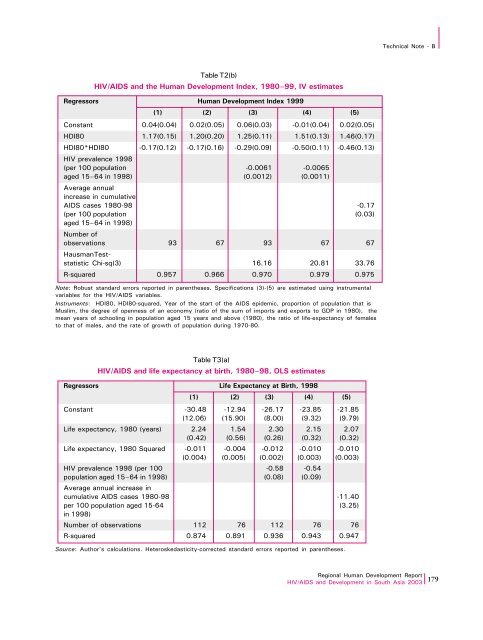
- Page 179 and 180: Technical Note - BThe full list of
- Page 181 and 182: Technical Note - B(13) H =(α∗ρ
- Page 183: Technical Note - BTable T1Human dev
- Page 187 and 188: Technical Note - BTable T7HIV/AIDS
- Page 189 and 190: Technical Note - BDominican Republi
- Page 191 and 192: Statistical TablesStatistical Table
- Page 193 and 194: Statistical TablesTable 3Profile of
- Page 195 and 196: Statistical TablesRegional Human De
- Page 197 and 198: Country act SheetsRegional Human De
- Page 199 and 200: Country act SheetsBANGLADESHIndicat
- Page 201 and 202: Country act SheetsINDIAIndicator Ye
- Page 203 and 204: Country act SheetsMALDIVESIndicator
- Page 205 and 206: Country act SheetsPAKISTANIndicator
- Page 207: Country act SheetsRegional Human De