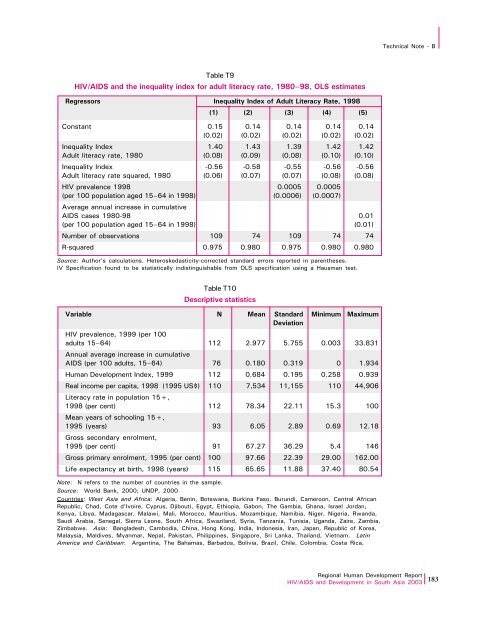
Technical Note - BTable T9HIV/AIDS and the inequality index for adult literacy rate, 1980–98, OLS estimatesRegressors Inequality Index of Adult Literacy Rate, 1998(1) (2) (3) (4) (5)Constant 0.15 0.14 0.14 0.14 0.14(0.02) (0.02) (0.02) (0.02) (0.02)Inequality Index 1.401.43 1.39 1.42 1.42Adult literacy rate, 1980 (0.08) (0.09) (0.08) (0.10) (0.10)Inequality Index -0.56 -0.58 -0.55 -0.56 -0.56Adult literacy rate squared, 1980 (0.06) (0.07) (0.07) (0.08) (0.08)HIV prevalence 1998 0.0005 0.0005(per 100 population aged 15–64 in 1998) (0.0006) (0.0007)Average annual increase in cumulativeAIDS cases 1980-98 0.01(per 100 population aged 15–64 in 1998) (0.01)Number of observations 109 74 109 74 74R-squared 0.975 0.980 0.975 0.980 0.980Source: Author’s calculations. Heteroskedasticity-corrected standard errors reported in parentheses.IV Specification found to be statistically indistinguishable from OLS specification using a Hausman test.Table T10Descriptive statisticsVariable N Mean Standard Minimum MaximumDeviationHIV prevalence, 1999 (per 100adults 15–64) 112 2.977 5.755 0.003 33.831Annual average increase in cumulativeAIDS (per 100 adults, 15–64) 76 0.180 0.319 0 1.934Human Development Index, 1999 112 0.684 0.195 0.258 0.939Real income per capita, 1998 (1995 US$) 1107,534 11,155 11044,906Literacy rate in population 15+,1998 (per cent) 112 78.34 22.11 15.3 100Mean years of schooling 15+,1995 (years) 93 6.05 2.89 0.69 12.18Gross secondary enrolment,1995 (per cent) 91 67.27 36.29 5.4 146Gross primary enrolment, 1995 (per cent) 100 97.66 22.39 29.00 162.00Life expectancy at birth, 1998 (years) 115 65.65 11.88 37.4080.54Note: N refers to the number of countries in the sample.Source: World Bank, 2000; <strong>UNDP</strong>, 2000Countries: West <strong>Asia</strong> and Africa: Algeria, Benin, Botswana, Burkina aso, Burundi, Cameroon, Central AfricanRepublic, Chad, Cote d’Ivoire, Cyprus, Djibouti, Egypt, Ethiopia, Gabon, The Gambia, Ghana, Israel Jordan,Kenya, Libya, Madagascar, Malawi, Mali, Morocco, Mauritius, Mozambique, Namibia, Niger, Nigeria, Rwanda,Saudi Arabia, Senegal, Sierra Leone, South Africa, Swaziland, Syria, Tanzania, Tunisia, Uganda, Zaire, Zambia,Zimbabwe. <strong>Asia</strong>: Bangladesh, Cambodia, China, Hong Kong, India, Indonesia, Iran, Japan, Republic of Korea,Malaysia, Maldives, Myanmar, Nepal, Pakistan, Philippines, Singapore, Sri Lanka, Thailand, Vietnam. LatinAmerica and Caribbean: Argentina, The Bahamas, Barbados, Bolivia, Brazil, Chile, Colombia, Costa Rica,<strong>Regional</strong> Human Development <strong>Report</strong>HIV/AIDS and Development in South <strong>Asia</strong> 2003 183
Technical Note - BDominican Republic, Ecuador, El Salvador, Guatemala, Guyana, Haiti, Honduras, Jamaica,Nicaragua, Panama, Paraguay, Peru, Trinidad and Tobago, Uruguay, Venezuela. North America:Canada, Mexico, <strong>United</strong> States. Oceania: Australia, New ZealandEurope: Austria, Belgium, Denmark, inland, rance, Germany, Greece, Hungary, Iceland, Ireland,Italy, Malta, Netherlands, New Zealand, Norway, Portugal, Spain, Sweden, Switzerland, Turkey,<strong>United</strong> KingdomEndnotes1 The key idea here is that economies that are initially richer (that is, with a greater initial realGDP per capita) grow at a slower pace than those with lower levels of GDP per capita – theso-called “convergence hypothesis ” (for example, Barro 1991). Define the t-year growth rateof real GDP per capita as [Y(t) – Y(0)]/Y(0). This growth is negatively correlated with Y(0),according to the convergence hypothesis, i.e., one could say, for example [Y(t) – Y(0)]/Y(0) =(*Y(0), with (< 0. But this implies precisely the concave relationship we refer to in the maintext.2 Thus, it is not unreasonable to imagine that both the HIV and AIDS variables used in this paperare indicative of the morbidity and mortality associated with the HIV/AIDS epidemic.3 Specifically, each component index, X i(i = 1,2,3) is calculated to be the following formulaX i= [¸ X if1-±+ (1-¸) X im1-±] 1/1-± (i= 1,2,3)Here, X ifis the index of female achievements in component “i”, and X imis the index of maleachievements in component “i” and ¸ is the female share in total population. The parameter“±” indicates the preferred degree of inequality aversion. In GDI calculations, it is taken to beequal to 2 (<strong>UNDP</strong> 2001). Information on GDI in 2000 was obtained from the Human Development<strong>Report</strong> (2001), and information on education variables and life expectancy variables, separatelyby gender, from the World Development Indicators database of the World Bank (World Bank2000). The latter set of information was used to construct the component inequality indices forlife expectancy at birth in 1980 and 1998, and adult literacy rates for 1980 and 1998.Specifications similar to (1) were estimated to assess the impact of HIV/AIDS on inequalityindices, with one exception. Because GDI information for 1980 was unavailable, 1980 values ofthe component index for the adult literacy rate and the component index for life expectancy atbirth were used as explanatory variables to control for influences other than HIV/AIDS that couldpossibly influence GDI.4 The start date of the epidemic was assumed to be the year the first AIDS case was reported ineach country, or a population sample found with HIV prevalence exceeding 0.5 per cent, furtheradjusted by the commonly accepted starting year of the epidemic for each region.5 Arndt and Lewis, 2000, p.12; Arndt and Lewis, 20016 Arndt and Lewis 2001, p.167 Arndt and Lewis, 2000, p.98 Bonnel 2000, p.3, McDonald and Roberts, 2001, p.69 Some qualifications to this claim are necessary. It is not obviously true that HIV prevalencerates among women visiting antenatal clinics are representative of prevalence rates amongmen. Are these rates reasonably representative of HIV-prevalence rates among women in thereproductive age group? Many people do not visit antenatal clinics, most of which are located<strong>Regional</strong> Human Development <strong>Report</strong>184 HIV/AIDS and Development in South <strong>Asia</strong> 2003