STRATEGIC PLAN - ASPE - U.S. Department of Health and Human ...
STRATEGIC PLAN - ASPE - U.S. Department of Health and Human ...
STRATEGIC PLAN - ASPE - U.S. Department of Health and Human ...
You also want an ePaper? Increase the reach of your titles
YUMPU automatically turns print PDFs into web optimized ePapers that Google loves.
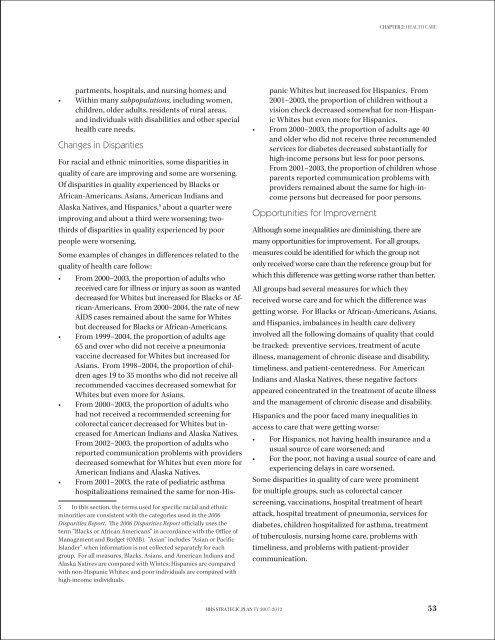
CHAPTER 2: <strong>Health</strong> carepartments, hospitals, <strong>and</strong> nursing homes; <strong>and</strong>• Within many subpopulations, including women,children, older adults, residents <strong>of</strong> rural areas,<strong>and</strong> individuals with disabilities <strong>and</strong> other specialhealth care needs.Changes in DisparitiesFor racial <strong>and</strong> ethnic minorities, some disparities inquality <strong>of</strong> care are improving <strong>and</strong> some are worsening.Of disparities in quality experienced by Blacks orAfrican-Americans, Asians, American Indians <strong>and</strong>Alaska Natives, <strong>and</strong> Hispanics, 5 about a quarter wereimproving <strong>and</strong> about a third were worsening; twothirds<strong>of</strong> disparities in quality experienced by poorpeople were worsening.Some examples <strong>of</strong> changes in differences related to thequality <strong>of</strong> health care follow:• From 2000–2003, the proportion <strong>of</strong> adults whoreceived care for illness or injury as soon as wanteddecreased for Whites but increased for Blacks or African-Americans.From 2000–2004, the rate <strong>of</strong> newAIDS cases remained about the same for Whitesbut decreased for Blacks or African-Americans.• From 1999–2004, the proportion <strong>of</strong> adults age65 <strong>and</strong> over who did not receive a pneumoniavaccine decreased for Whites but increased forAsians. From 1998–2004, the proportion <strong>of</strong> childrenages 19 to 35 months who did not receive allrecommended vaccines decreased somewhat forWhites but even more for Asians.• From 2000–2003, the proportion <strong>of</strong> adults whohad not received a recommended screening forcolorectal cancer decreased for Whites but increasedfor American Indians <strong>and</strong> Alaska Natives.From 2002–2003, the proportion <strong>of</strong> adults whoreported communication problems with providersdecreased somewhat for Whites but even more forAmerican Indians <strong>and</strong> Alaska Natives.• From 2001–2003, the rate <strong>of</strong> pediatric asthmahospitalizations remained the same for non-His-5 In this section, the terms used for specific racial <strong>and</strong> ethnicminorities are consistent with the categories used in the 2006Disparities Report. The 2006 Disparities Report <strong>of</strong>ficially uses theterm “Blacks or African Americans” in accordance with the Office <strong>of</strong>Management <strong>and</strong> Budget (OMB). “Asian” includes “Asian or PacificIsl<strong>and</strong>er” when information is not collected separately for eachgroup. For all measures, Blacks, Asians, <strong>and</strong> American Indians <strong>and</strong>Alaska Natives are compared with Whites; Hispanics are comparedwith non-Hispanic Whites; <strong>and</strong> poor individuals are compared withhigh-income individuals.•panic Whites but increased for Hispanics. From2001–2003, the proportion <strong>of</strong> children without avision check decreased somewhat for non-HispanicWhites but even more for Hispanics.From 2000–2003, the proportion <strong>of</strong> adults age 40<strong>and</strong> older who did not receive three recommendedservices for diabetes decreased substantially forhigh-income persons but less for poor persons.From 2001–2003, the proportion <strong>of</strong> children whoseparents reported communication problems withproviders remained about the same for high-incomepersons but decreased for poor persons.Opportunities for ImprovementAlthough some inequalities are diminishing, there aremany opportunities for improvement. For all groups,measures could be identified for which the group notonly received worse care than the reference group but forwhich this difference was getting worse rather than better.All groups had several measures for which theyreceived worse care <strong>and</strong> for which the difference wasgetting worse. For Blacks or African-Americans, Asians,<strong>and</strong> Hispanics, imbalances in health care deliveryinvolved all the following domains <strong>of</strong> quality that couldbe tracked: preventive services, treatment <strong>of</strong> acuteillness, management <strong>of</strong> chronic disease <strong>and</strong> disability,timeliness, <strong>and</strong> patient-centeredness. For AmericanIndians <strong>and</strong> Alaska Natives, these negative factorsappeared concentrated in the treatment <strong>of</strong> acute illness<strong>and</strong> the management <strong>of</strong> chronic disease <strong>and</strong> disability.Hispanics <strong>and</strong> the poor faced many inequalities inaccess to care that were getting worse:• For Hispanics, not having health insurance <strong>and</strong> ausual source <strong>of</strong> care worsened; <strong>and</strong>• For the poor, not having a usual source <strong>of</strong> care <strong>and</strong>experiencing delays in care worsened.Some disparities in quality <strong>of</strong> care were prominentfor multiple groups, such as colorectal cancerscreening, vaccinations, hospital treatment <strong>of</strong> heartattack, hospital treatment <strong>of</strong> pneumonia, services fordiabetes, children hospitalized for asthma, treatment<strong>of</strong> tuberculosis, nursing home care, problems withtimeliness, <strong>and</strong> problems with patient-providercommunication.HHS Strategic Plan FY 2007-201253


