Cohort mortality in Sweden (pdf)
Cohort mortality in Sweden (pdf)
Cohort mortality in Sweden (pdf)

You also want an ePaper? Increase the reach of your titles
YUMPU automatically turns print PDFs into web optimized ePapers that Google loves.
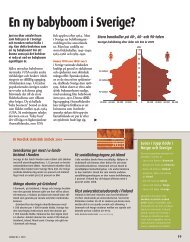
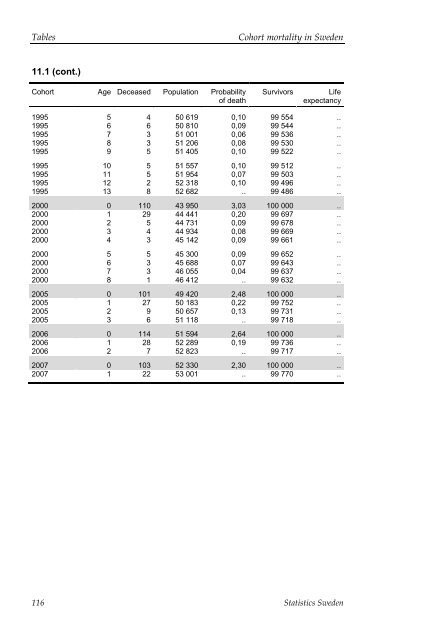
Tables<strong>Cohort</strong> <strong>mortality</strong> <strong>in</strong> <strong>Sweden</strong>11.1 (cont.)<strong>Cohort</strong> Age Deceased Population Probabilityof deathSurvivorsLifeexpectancy1995 5 4 50 619 0,10 99 554 ..1995 6 6 50 810 0,09 99 544 ..1995 7 3 51 001 0,06 99 536 ..1995 8 3 51 206 0,08 99 530 ..1995 9 5 51 405 0,10 99 522 ..1995 10 5 51 557 0,10 99 512 ..1995 11 5 51 954 0,07 99 503 ..1995 12 2 52 318 0,10 99 496 ..1995 13 8 52 682 .. 99 486 ..2000 0 110 43 950 3,03 100 000 ..2000 1 29 44 441 0,20 99 697 ..2000 2 5 44 731 0,09 99 678 ..2000 3 4 44 934 0,08 99 669 ..2000 4 3 45 142 0,09 99 661 ..2000 5 5 45 300 0,09 99 652 ..2000 6 3 45 688 0,07 99 643 ..2000 7 3 46 055 0,04 99 637 ..2000 8 1 46 412 .. 99 632 ..2005 0 101 49 420 2,48 100 000 ..2005 1 27 50 183 0,22 99 752 ..2005 2 9 50 657 0,13 99 731 ..2005 3 6 51 118 .. 99 718 ..2006 0 114 51 594 2,64 100 000 ..2006 1 28 52 289 0,19 99 736 ..2006 2 7 52 823 .. 99 717 ..2007 0 103 52 330 2,30 100 000 ..2007 1 22 53 001 .. 99 770 ..116 Statistics <strong>Sweden</strong>