Cohort mortality in Sweden (pdf)
Cohort mortality in Sweden (pdf)
Cohort mortality in Sweden (pdf)

You also want an ePaper? Increase the reach of your titles
YUMPU automatically turns print PDFs into web optimized ePapers that Google loves.
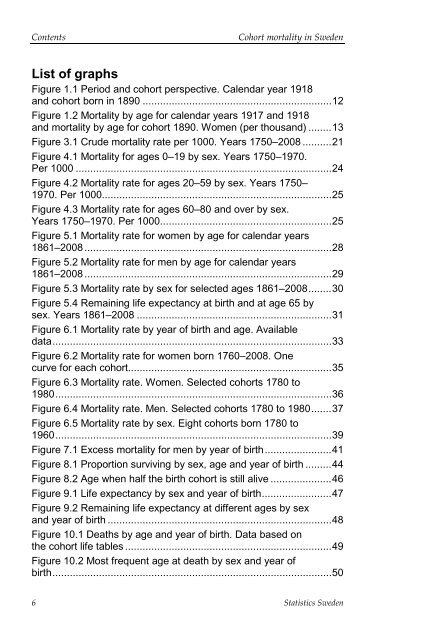
Contents<strong>Cohort</strong> <strong>mortality</strong> <strong>in</strong> <strong>Sweden</strong>List of graphsFigure 1.1 Period and cohort perspective. Calendar year 1918and cohort born <strong>in</strong> 1890 ................................................................. 12Figure 1.2 Mortality by age for calendar years 1917 and 1918and <strong>mortality</strong> by age for cohort 1890. Women (per thousand) ........ 13Figure 3.1 Crude <strong>mortality</strong> rate per 1000. Years 1750–2008 .......... 21Figure 4.1 Mortality for ages 0–19 by sex. Years 1750–1970.Per 1000 ........................................................................................ 24Figure 4.2 Mortality rate for ages 20–59 by sex. Years 1750–1970. Per 1000............................................................................... 25Figure 4.3 Mortality rate for ages 60–80 and over by sex.Years 1750–1970. Per 1000........................................................... 25Figure 5.1 Mortality rate for women by age for calendar years1861–2008 ..................................................................................... 28Figure 5.2 Mortality rate for men by age for calendar years1861–2008 ..................................................................................... 29Figure 5.3 Mortality rate by sex for selected ages 1861–2008 ........ 30Figure 5.4 Rema<strong>in</strong><strong>in</strong>g life expectancy at birth and at age 65 bysex. Years 1861–2008 ................................................................... 31Figure 6.1 Mortality rate by year of birth and age. Availabledata ................................................................................................ 33Figure 6.2 Mortality rate for women born 1760–2008. Onecurve for each cohort...................................................................... 35Figure 6.3 Mortality rate. Women. Selected cohorts 1780 to1980 ............................................................................................... 36Figure 6.4 Mortality rate. Men. Selected cohorts 1780 to 1980 ....... 37Figure 6.5 Mortality rate by sex. Eight cohorts born 1780 to1960 ............................................................................................... 39Figure 7.1 Excess <strong>mortality</strong> for men by year of birth ....................... 41Figure 8.1 Proportion surviv<strong>in</strong>g by sex, age and year of birth ......... 44Figure 8.2 Age when half the birth cohort is still alive ..................... 46Figure 9.1 Life expectancy by sex and year of birth ........................ 47Figure 9.2 Rema<strong>in</strong><strong>in</strong>g life expectancy at different ages by sexand year of birth ............................................................................. 48Figure 10.1 Deaths by age and year of birth. Data based onthe cohort life tables ....................................................................... 49Figure 10.2 Most frequent age at death by sex and year ofbirth ................................................................................................ 506 Statistics <strong>Sweden</strong>