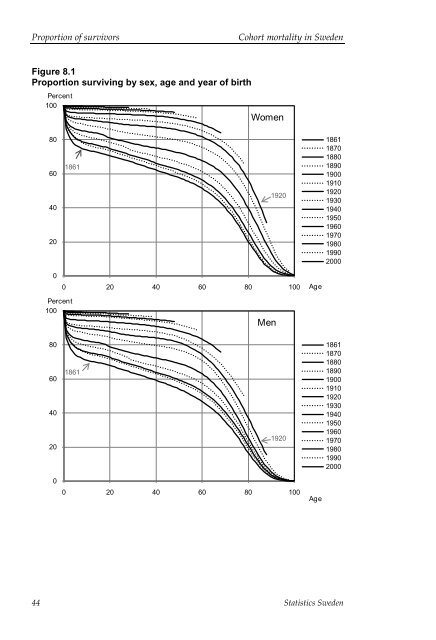
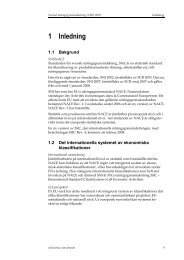
Proportion of survivors<strong>Cohort</strong> <strong>mortality</strong> <strong>in</strong> <strong>Sweden</strong>Figure 8.1Proportion surviv<strong>in</strong>g by sex, age and year of birthPercent100Women806040201861192018611870188018901900191019201930194019501960197019801990200000 20 40 60 80 100AgePercent100Men806040201861192018611870188018901900191019201930194019501960197019801990200000 20 40 60 80 100Age44 Statistics <strong>Sweden</strong>
<strong>Cohort</strong> <strong>mortality</strong> <strong>in</strong> <strong>Sweden</strong>Proportion of survivorsTable 8.1Proportion of survivors by age, sex, and year of birth. Percent<strong>Cohort</strong> 1 15 30 45 60 75 90Kv M Kv M Kv M Kv M Kv M Kv M Kv M1861 86,2 84,1 72,3 69,5 66,6 63,5 59,9 56,8 51,4 46,7 31,3 26,8 3,5 2,41865 87,3 85,1 74,3 71,8 68,5 65,6 61,8 58,8 53 49,3 32,3 27,9 3,8 2,81870 87,8 85,9 75,2 73,4 69,2 67,2 62,7 60,8 53,9 51,2 33,4 29,9 4,3 3,11875 85,9 83,7 72,7 70,6 67 64,7 60,7 58,4 52,4 50 33,2 29,6 4,7 3,31880 88,6 86,5 76,6 74,4 70,7 68,3 64,3 61,9 56,2 52,7 36,6 31,8 5,8 3,71885 89,2 87,2 78,7 77 72,5 71 66,3 64,6 58,5 55,6 39,3 33,9 7,4 4,31890 90,1 88,1 80,3 78,2 73,5 70,8 68,5 65,7 61,2 57,3 42,5 34,8 9,1 4,41895 91,2 89,6 82,6 81 76,1 73,5 71,6 68,7 64,7 60,4 46,7 36,7 11,2 4,81900 91 88,9 83,5 81,3 77,7 75,1 73,8 70,9 67,7 63 50,7 38,3 13,5 5,41905 92,4 90,8 86,2 84,5 81,5 79,7 78,1 75,9 72,7 67,8 55,7 41,5 16,3 6,51910 93,3 91,5 87,5 85,7 83,5 81,6 80,8 78,6 75,5 70,7 59,8 44,7 18,7 7,71915 93,5 92 88,2 86,7 85,1 82,9 83 80,3 77,8 72,1 62,7 46,6 21 8,81920 94,4 92,7 90,9 88,8 88,5 85,4 86,7 83 81,6 74,3 66,5 49,71925 95,2 93,8 92,3 90,4 90,5 88 88,9 85,4 84 76,5 69,3 53,51930 94,9 93,5 92,6 90,7 91,6 88,9 89,9 86,3 85,3 78 71,4 56,71935 96,1 94,8 94,3 92,6 93,5 91,1 91,9 88,3 87,4 80,91940 96,6 95,7 95,3 94 94,7 92,4 93,3 89,7 89,1 83,31945 97,6 96,8 96,8 95,6 96,1 94,1 94,7 91,8 90,5 85,81950 98,1 97,6 97,4 96,7 96,7 95,2 95,5 931955 98,5 98 97,9 97,2 97,2 95,6 96,1 93,61960 98,6 98,1 98 97,4 97,4 96 96,4 94,21965 98,8 98,5 98,4 97,9 97,9 96,81970 99 98,7 98,7 98,3 98,3 97,21975 99,3 99 99 98,7 98,6 97,71980 99,4 99,2 99,2 98,91985 99,4 99,3 99,1 991990 99,5 99,3 99,3 99,11995 99,6 99,52000 99,7 99,62005 99,8 99,7Statistics <strong>Sweden</strong> 45