Cohort mortality in Sweden (pdf)
Cohort mortality in Sweden (pdf)
Cohort mortality in Sweden (pdf)
You also want an ePaper? Increase the reach of your titles
YUMPU automatically turns print PDFs into web optimized ePapers that Google loves.
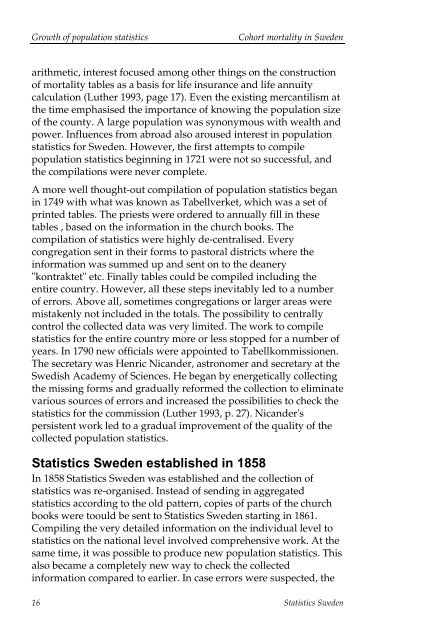
Growth of population statistics<strong>Cohort</strong> <strong>mortality</strong> <strong>in</strong> <strong>Sweden</strong>arithmetic, <strong>in</strong>terest focused among other th<strong>in</strong>gs on the constructionof <strong>mortality</strong> tables as a basis for life <strong>in</strong>surance and life annuitycalculation (Luther 1993, page 17). Even the exist<strong>in</strong>g mercantilism atthe time emphasised the importance of know<strong>in</strong>g the population sizeof the county. A large population was synonymous with wealth andpower. Influences from abroad also aroused <strong>in</strong>terest <strong>in</strong> populationstatistics for <strong>Sweden</strong>. However, the first attempts to compilepopulation statistics beg<strong>in</strong>n<strong>in</strong>g <strong>in</strong> 1721 were not so successful, andthe compilations were never complete.A more well thought-out compilation of population statistics began<strong>in</strong> 1749 with what was known as Tabellverket, which was a set ofpr<strong>in</strong>ted tables. The priests were ordered to annually fill <strong>in</strong> thesetables , based on the <strong>in</strong>formation <strong>in</strong> the church books. Thecompilation of statistics were highly de-centralised. Everycongregation sent <strong>in</strong> their forms to pastoral districts where the<strong>in</strong>formation was summed up and sent on to the deanery"kontraktet" etc. F<strong>in</strong>ally tables could be compiled <strong>in</strong>clud<strong>in</strong>g theentire country. However, all these steps <strong>in</strong>evitably led to a numberof errors. Above all, sometimes congregations or larger areas weremistakenly not <strong>in</strong>cluded <strong>in</strong> the totals. The possibility to centrallycontrol the collected data was very limited. The work to compilestatistics for the entire country more or less stopped for a number ofyears. In 1790 new officials were appo<strong>in</strong>ted to Tabellkommissionen.The secretary was Henric Nicander, astronomer and secretary at theSwedish Academy of Sciences. He began by energetically collect<strong>in</strong>gthe miss<strong>in</strong>g forms and gradually reformed the collection to elim<strong>in</strong>atevarious sources of errors and <strong>in</strong>creased the possibilities to check thestatistics for the commission (Luther 1993, p. 27). Nicander'spersistent work led to a gradual improvement of the quality of thecollected population statistics.Statistics <strong>Sweden</strong> established <strong>in</strong> 1858In 1858 Statistics <strong>Sweden</strong> was established and the collection ofstatistics was re-organised. Instead of send<strong>in</strong>g <strong>in</strong> aggregatedstatistics accord<strong>in</strong>g to the old pattern, copies of parts of the churchbooks were toould be sent to Statistics <strong>Sweden</strong> start<strong>in</strong>g <strong>in</strong> 1861.Compil<strong>in</strong>g the very detailed <strong>in</strong>formation on the <strong>in</strong>dividual level tostatistics on the national level <strong>in</strong>volved comprehensive work. At thesame time, it was possible to produce new population statistics. Thisalso became a completely new way to check the collected<strong>in</strong>formation compared to earlier. In case errors were suspected, the16 Statistics <strong>Sweden</strong>


