ourexpertise - Crédit Agricole CIB
ourexpertise - Crédit Agricole CIB
ourexpertise - Crédit Agricole CIB

Create successful ePaper yourself
Turn your PDF publications into a flip-book with our unique Google optimized e-Paper software.
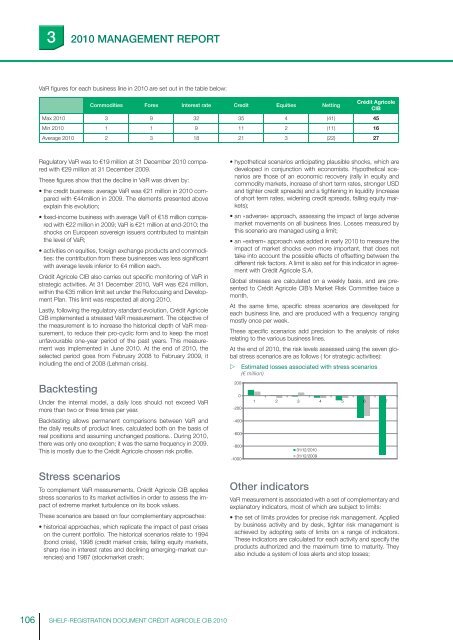
32010 MANAGEMENT REPORTVaR fi gures for each business line in 2010 are set out in the table below:Commodities Forex Interest rate Credit Equities Netting<strong>Crédit</strong> <strong>Agricole</strong><strong>CIB</strong>Max 2010 3 9 32 35 4 (41) 45Min 2010 1 1 9 11 2 (11) 16Average 2010 2 3 18 21 3 (22) 27Regulatory VaR was to €19 million at 31 December 2010 comparedwith €29 million at 31 December 2009.These fi gures show that the decline in VaR was driven by:• the credit business: average VaR was €21 million in 2010 comparedwith €44million in 2009. The elements presented aboveexplain this evolution;• fi xed-income business with average VaR of €18 million comparedwith €22 million in 2009; VaR is €21 million at end-2010; theshocks on European sovereign issuers contributed to maintainthe level of VaR;• activities on equities, foreign exchange products and commodities:the contribution from these businesses was less signifi cantwith average levels inferior to €4 million each.<strong>Crédit</strong> <strong>Agricole</strong> <strong>CIB</strong> also carries out specifi c monitoring of VaR instrategic activities. At 31 December 2010, VaR was €24 million,within the €35 million limit set under the Refocusing and DevelopmentPlan. This limit was respected all along 2010.Lastly, following the regulatory standard evolution, <strong>Crédit</strong> <strong>Agricole</strong><strong>CIB</strong> implemented a stressed VaR measurement. The objective ofthe measurement is to increase the historical depth of VaR measurement,to reduce their pro-cyclic form and to keep the mostunfavourable one-year period of the past years. This measurementwas implemented in June 2010. At the end of 2010, theselected period goes from February 2008 to February 2009, itincluding the end of 2008 (Lehman crisis).• hypothetical scenarios anticipating plausible shocks, which aredeveloped in conjunction with economists. Hypothetical scenariosare those of an economic recovery (rally in equity andcommodity markets, increase of short term rates, stronger USDand tighter credit spreads) and a tightening in liquidity (increaseof short term rates, widening credit spreads, falling equity markets);• an « adverse« approach, assessing the impact of large adversemarket movements on all business lines. Losses measured bythis scenario are managed using a limit;• an « extrem« approach was added in early 2010 to measure theimpact of market shocks even more important, that does nottake into account the possible effects of offsetting between thedifferent risk factors. A limit is also set for this indicator in agreementwith <strong>Crédit</strong> <strong>Agricole</strong> S.A.Global stresses are calculated on a weekly basis, and are presentedto <strong>Crédit</strong> <strong>Agricole</strong> <strong>CIB</strong>’s Market Risk Committee twice amonth.At the same time, specifi c stress scenarios are developed foreach business line, and are produced with a frequency rangingmostly once per week.These specifi c scenarios add precision to the analysis of risksrelating to the various business lines.At the end of 2010, the risk levels assessed using the seven globalstress scenarios are as follows ( for strategic activities): Estimated losses associated with stress scenarios(€ million)BacktestingUnder the internal model, a daily loss should not exceed VaRmore than two or three times per year.Backtesting allows permanent comparisons between VaR andthe daily results of product lines, calculated both on the basis ofreal positions and assuming unchanged positions.. During 2010,there was only one exception; it was the same frequency in 2009.This is mostly due to the <strong>Crédit</strong> <strong>Agricole</strong> chosen risk profi le.2000-200-400-600-800-10001 2 3 4 5 6 731/12/201031/12/2009Stress scenariosTo complement VaR measurements, <strong>Crédit</strong> <strong>Agricole</strong> <strong>CIB</strong> appliesstress scenarios to its market activities in order to assess the impactof extreme market turbulence on its book values.These scenarios are based on four complementary approaches:• historical approaches, which replicate the impact of past criseson the current portfolio. The historical scenarios relate to 1994(bond crisis), 1998 (credit market crisis, falling equity markets,sharp rise in interest rates and declining emerging-market currencies)and 1987 (stockmarket crash;Other indicatorsVaR measurement is associated with a set of complementary andexplanatory indicators, most of which are subject to limits:• the set of limits provides for precise risk management. Appliedby business activity and by desk, tighter risk management isachieved by adopting sets of limits on a range of indicators.These indicators are calculated for each activity and specify theproducts authorized and the maximum time to maturity. Theyalso include a system of loss alerts and stop losses;106SHELF-REGISTRATION DOCUMENT CRÉDIT AGRICOLE <strong>CIB</strong> 2010