32010 MANAGEMENT REPORT• Quality exposure by geographical area€ millionStandardisedapproachPast due exposure (1)2010 2009 (2)IRBapproachExposure at defaultIRBapproachExposure at defaultWestern Europe excluding Italy 83 1,023 1,549Italy 760 913Eastern Europe 251 259North America 377 626Central and South America 787 749Asia and Pacifi c excluding Japan 241 157Japan 40 7Africa and Middle-East 732 508Total 83 4,210 4,768(1)More than 90 days past due.(2)Corrected data.Quality of exposure• Quality of exposure by type of customerstandardised approachCredit valuation under the standardised approachWhen no external credit valuation is available, <strong>Crédit</strong> <strong>Agricole</strong> <strong>CIB</strong>uses the French Prudential Supervisory Authority weighting.The <strong>Crédit</strong> <strong>Agricole</strong> <strong>CIB</strong> Group also cross-references external creditevaluations with the various credit quality steps published bythe French Prudential Supervisory Authority.For the Central Governments/Central Banks and Corporatescategories, under the standardised approach, the <strong>Crédit</strong> <strong>Agricole</strong><strong>CIB</strong> Group has chosen to use Moody’s evaluations to assess sovereignrisk, along with French Prudential Supervisory Authority’stable to cross-reference with credit quality steps.As regards Corporates, the Group does not use external creditevaluation organisations. Corporates are weighted at 100% or150% when exposures to government of the country in whichthe company is established is weighted at 150%, in accordancewith regulations. As a result, it is not possible to break down corporateexposures by credit quality step using the standardisedapproach.• Credit quality step analysis of exposures and exposure at default (EAD)Central government and central banks€ millionWeightingsAmount ofexposures31.12.2010 31.12.2009Amount ofEADAmount ofexposuresAmount ofEAD0% 24,350 24,201 7,922 7,90720% 1 150%100% 289 289 316 316Total 24,639 24,490 8,239 8,224Institutions€ millionWeightingsAmount ofexposures31.12.2010 31.12.2009Amount ofEADAmount ofexposuresAmount ofEAD20% 13,606 13,268 12,548 12,48350% 5 5 536 285100% 46 25 295 250150%Total 13,656 13,298 13,379 13,018132SHELF-REGISTRATION DOCUMENT CRÉDIT AGRICOLE <strong>CIB</strong> 2010
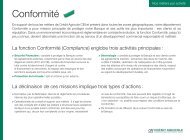
2010 MANAGEMENT REPORT 3• Exposure under the IRB approachPresentation of the internal rating system and procedureInternal rating systems and procedures are presented in the management report in the « Risk management - Counterparty risk - Risk measurementmethods and system« section on pages 96 to 98.Credit risk exposure by category of exposure and internal rating at 31 December 2010 (excluding defaultedexposure)€ millionInternalobligorratingGrossexposureEADEAD(Balancesheet)EAD(Offbalancesheet )RWAAverageLGDAverageRWExpectedLoss(EL)1 42,331 43,129 38,280 4,848 88 2% 0% 02 381 421 339 82 14 6% 3% 0Central governments 3 2,608 1,405 1,001 404 252 18% 18% 1andcentral banks4 584 196 155 41 210 41% 107% 15 129 59 55 4 117 61% 199% 26 149 39 27 12 198 86% 511% 7Sub-total 46,182 45,249 39,858 5,391 878 101 41,707 42,817 19,528 23,290 1,516 13% 4% 22 13,839 13,184 4,382 8,802 1,278 22% 10% 2Institutions3 17,760 15,395 6,424 8,971 5,261 31% 34% 144 1,423 1,109 601 508 942 50% 85% 55 49 17 8 9 47 85% 269% 16 635 100 47 53 342 63% 342% 10Sub-total 75,412 72,623 30,990 41,633 9,386 341 31,812 43,524 18,208 25,316 3,104 21% 7% 32 41,091 30,498 11,393 19,106 5,236 38% 17% 7Corporates3 103,917 79,063 44,222 34,842 29,976 35% 38% 744 38,510 27,101 17,075 10,026 21,302 35% 79% 1085 4,769 3,121 1,877 1,244 3,788 36% 121% 546 5,258 4,239 2,927 1,312 6,006 30% 142% 179Sub-total 225,357 187,547 95,702 91,845 69,412 4241 520 516 501 16 3 6% 1% 02 2,539 2,538 2,532 6 18 4% 1% 0Retail customers3 3,711 3,704 3,691 13 183 12% 5% 14 13 13 13 0 11 63% 81% 06 50 50 50 0 72 72% 143% 5Sub-total 6,834 6,822 6,787 35 287 6Total 353,785 312,240 173,337 138,903 79,963 474SHELF-REGISTRATION DOCUMENT CRÉDIT AGRICOLE <strong>CIB</strong> 2010 133