- Page 1:
ROOTEDANNUAL REPORT 2012
- Page 5 and 6:
ROOTEDNATIONAL SAVINGS BANK l ANNUA
- Page 7 and 8:
5MISSIONProviding our customers wit
- Page 9 and 10:
7ROOTEDFor over 40 years, the Natio
- Page 11 and 12:
92000Establishment of subsidiary co
- Page 13 and 14:
11HOW WE PERFORMED IN 2012FINANCIAL
- Page 15 and 16:
13CHAPTER 1FIRMLY ANCHOREDSTRATEGY
- Page 17 and 18:
15A MESSAGE FROM MR SUNIL S. SIRISE
- Page 19 and 20:
17A MESSAGE FROM MR SUNIL S. SIRISE
- Page 21 and 22:
19A REVIEW BYMR. HENNAYAKE BANDARAG
- Page 23 and 24:
21A REVIEW BY MR HENNAYAKE BANDARAG
- Page 25 and 26:
23A REVIEW BY MR HENNAYAKE BANDARAG
- Page 27 and 28:
25CHAPTER 2HOW WE PERFORMED IN 2012
- Page 29 and 30:
27HOW WE PERFORMED IN 2012FINANCIAL
- Page 31 and 32:
29HOW WE PERFORMED IN 2012FINANCIAL
- Page 33 and 34:
31HOW WE PERFORMED IN 2012FINANCIAL
- Page 35 and 36:
33HOW WE PERFORMED IN 2012ECONOMIC
- Page 37 and 38:
35HOW WE PERFORMED IN 2012ECONOMIC
- Page 39 and 40:
37HOW WE PERFORMED IN 2012ACHIEVEME
- Page 41 and 42:
39HOW WE PERFORMED IN 2012OPERATION
- Page 43 and 44:
41HOW WE PERFORMED IN 2012OPERATION
- Page 45 and 46:
43HOW WE PERFORMED IN 2012OPERATION
- Page 47 and 48:
45HOW WE PERFORMED IN 2012OPERATION
- Page 49 and 50:
47HOW WE PERFORMED IN 2012OPERATION
- Page 51 and 52:
49HOW WE PERFORMED IN 2012OPERATION
- Page 53 and 54:
51HOW WE PERFORMED IN 2012FUTURE PL
- Page 55 and 56:
53CHAPTER 3ROOTED IN OUR HERITAGEGO
- Page 57 and 58:
55ROOTED IN OUR HERITAGEGOVERNANCE
- Page 59 and 60:
57ROOTED IN OUR HERITAGEGOVERNANCE
- Page 61 and 62:
59ROOTED IN OUR HERITAGEGOVERNANCE
- Page 63 and 64:
61ROOTED IN OUR HERITAGEGOVERNANCE
- Page 65 and 66:
63ROOTED IN OUR HERITAGEGOVERNANCE
- Page 67 and 68:
65ROOTED IN OUR HERITAGEGOVERNANCE
- Page 69 and 70:
67ROOTED IN OUR HERITAGEGOVERNANCE
- Page 71 and 72:
69ROOTED IN OUR HERITAGEGOVERNANCE
- Page 73 and 74:
71ROOTED IN OUR HERITAGEGOVERNANCE
- Page 75 and 76:
73ROOTED IN OUR HERITAGEGOVERNANCE
- Page 77 and 78:
75ROOTED IN OUR HERITAGEGOVERNANCE
- Page 79 and 80: 77ROOTED IN OUR HERITAGEGOVERNANCE
- Page 81 and 82: 79ROOTED IN OUR HERITAGEGOVERNANCE
- Page 83 and 84: 81ROOTED IN OUR HERITAGEGOVERNANCE
- Page 85 and 86: 83ROOTED IN OUR HERITAGEGOVERNANCE
- Page 87 and 88: 85ROOTED IN OUR HERITAGEBOARD OF DI
- Page 89 and 90: 87ROOTED IN OUR HERITAGEBOARD OF DI
- Page 91 and 92: 89ROOTED IN OUR HERITAGEGENERAL MAN
- Page 93 and 94: 91ROOTED IN OUR HERITAGECORPORATE M
- Page 95 and 96: 93ROOTED IN OUR HERITAGEEXECUTIVE M
- Page 97 and 98: 95ROOTED IN OUR HERITAGEREPORT OF T
- Page 99 and 100: 97ROOTED IN OUR HERITAGEREPORT OF T
- Page 101 and 102: 99ROOTED IN OUR HERITAGEREPORT OF T
- Page 103 and 104: 101ROOTED IN OUR HERITAGEREPORT OF
- Page 105 and 106: 103CHAPTER 4ASSESSING AND MANAGING
- Page 107 and 108: 105ASSESSING AND MANAGING OUR RISK
- Page 109 and 110: 107ASSESSING AND MANAGING OUR RISK
- Page 111 and 112: 109ASSESSING AND MANAGING OUR RISK
- Page 113 and 114: 111ASSESSING AND MANAGING OUR RISK
- Page 115 and 116: 113ASSESSING AND MANAGING OUR RISK
- Page 117 and 118: 115ASSESSING AND MANAGING OUR RISK
- Page 119 and 120: 117ASSESSING AND MANAGING OUR RISK
- Page 121 and 122: 119ASSESSING AND MANAGING OUR RISK
- Page 123 and 124: 121ASSESSING AND MANAGING OUR RISK
- Page 125 and 126: 123ASSESSING AND MANAGING OUR RISK
- Page 127 and 128: 125ASSESSING AND MANAGING OUR RISK
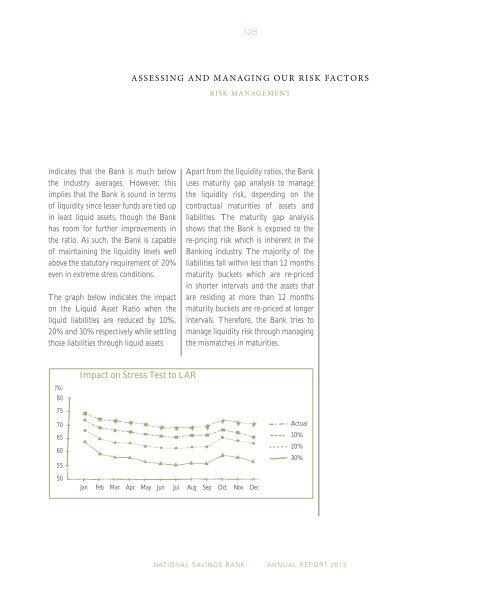
- Page 129: 127ASSESSING AND MANAGING OUR RISK
- Page 133 and 134: 131ASSESSING AND MANAGING OUR RISK
- Page 135 and 136: 133ASSESSING AND MANAGING OUR RISK
- Page 137 and 138: 135ASSESSING AND MANAGING OUR RISK
- Page 139 and 140: 137CHAPTER 5BRANCHING OUT INTO NEW
- Page 141 and 142: 139BRANCHING OUT INTO NEW VENTURESS
- Page 143 and 144: 141BRANCHING OUT INTO NEW VENTURESS
- Page 145 and 146: 143BRANCHING OUT INTO NEW VENTURESS
- Page 147 and 148: 145BRANCHING OUT INTO NEW VENTURESS
- Page 149 and 150: 147BRANCHING OUT INTO NEW VENTURESS
- Page 151 and 152: 149BRANCHING OUT INTO NEW VENTURESS
- Page 153 and 154: 151BRANCHING OUT INTO NEW VENTURESS
- Page 155 and 156: 153BRANCHING OUT INTO NEW VENTURESS
- Page 157 and 158: 155BRANCHING OUT INTO NEW VENTURESS
- Page 159 and 160: 157BRANCHING OUT INTO NEW VENTURESS
- Page 161 and 162: 159BRANCHING OUT INTO NEW VENTURESS
- Page 163 and 164: 161BRANCHING OUT INTO NEW VENTURESS
- Page 165 and 166: 163BRANCHING OUT INTO NEW VENTURESS
- Page 167 and 168: 165BRANCHING OUT INTO NEW VENTURESS
- Page 169 and 170: 167BRANCHING OUT INTO NEW VENTURESS
- Page 171 and 172: 169BRANCHING OUT INTO NEW VENTURESS
- Page 173 and 174: 171BRANCHING OUT INTO NEW VENTURESS
- Page 175 and 176: 173BRANCHING OUT INTO NEW VENTURESG
- Page 177 and 178: 175BRANCHING OUT INTO NEW VENTURESG
- Page 179 and 180: 177BRANCHING OUT INTO NEW VENTURESG
- Page 181 and 182:
179BRANCHING OUT INTO NEW VENTURESG
- Page 183 and 184:
181BRANCHING OUT INTO NEW VENTURESG
- Page 185 and 186:
183CHAPTER 6THE RESULTS OF A CHALLE
- Page 187 and 188:
185THE RESULTS OF A CHALLENGING YEA
- Page 189 and 190:
187THE RESULTS OF A CHALLENGING YEA
- Page 191 and 192:
189THE RESULTS OF A CHALLENGING YEA
- Page 193 and 194:
191THE RESULTS OF A CHALLENGING YEA
- Page 195 and 196:
193THE RESULTS OF A CHALLENGING YEA
- Page 197 and 198:
195THE RESULTS OF A CHALLENGING YEA
- Page 199 and 200:
197THE RESULTS OF A CHALLENGING YEA
- Page 201 and 202:
199THE RESULTS OF A CHALLENGING YEA
- Page 203 and 204:
201THE RESULTS OF A CHALLENGING YEA
- Page 205 and 206:
203THE RESULTS OF A CHALLENGING YEA
- Page 207 and 208:
205THE RESULTS OF A CHALLENGING YEA
- Page 209 and 210:
207THE RESULTS OF A CHALLENGING YEA
- Page 211 and 212:
209THE RESULTS OF A CHALLENGING YEA
- Page 213 and 214:
211THE RESULTS OF A CHALLENGING YEA
- Page 215 and 216:
213THE RESULTS OF A CHALLENGING YEA
- Page 217 and 218:
215THE RESULTS OF A CHALLENGING YEA
- Page 219 and 220:
217THE RESULTS OF A CHALLENGING YEA
- Page 221 and 222:
219THE RESULTS OF A CHALLENGING YEA
- Page 223 and 224:
221THE RESULTS OF A CHALLENGING YEA
- Page 225 and 226:
223THE RESULTS OF A CHALLENGING YEA
- Page 227 and 228:
225THE RESULTS OF A CHALLENGING YEA
- Page 229 and 230:
227THE RESULTS OF A CHALLENGING YEA
- Page 231 and 232:
229THE RESULTS OF A CHALLENGING YEA
- Page 233 and 234:
231THE RESULTS OF A CHALLENGING YEA
- Page 235 and 236:
233THE RESULTS OF A CHALLENGING YEA
- Page 237 and 238:
235THE RESULTS OF A CHALLENGING YEA
- Page 239 and 240:
237THE RESULTS OF A CHALLENGING YEA
- Page 241 and 242:
239THE RESULTS OF A CHALLENGING YEA
- Page 243 and 244:
241THE RESULTS OF A CHALLENGING YEA
- Page 245 and 246:
243THE RESULTS OF A CHALLENGING YEA
- Page 247 and 248:
245THE RESULTS OF A CHALLENGING YEA
- Page 249 and 250:
247THE RESULTS OF A CHALLENGING YEA
- Page 251 and 252:
249THE RESULTS OF A CHALLENGING YEA
- Page 253 and 254:
251CHAPTER 7ANNEXURESNATIONAL SAVIN
- Page 255 and 256:
253STATEMENT OF FINANCIAL POSITION
- Page 257 and 258:
255TEN YEARS AT A GLANCE(Rs Mn)Year
- Page 259 and 260:
257OUR PRODUCTS AND SERVICESSAVINGS
- Page 261 and 262:
259OUR PRODUCTS AND SERVICES19. Ran
- Page 263 and 264:
261OUR PRODUCTS AND SERVICESOUR EXT
- Page 265 and 266:
263BRANCH NETWORKCentral Province1.
- Page 267 and 268:
265CORRESPONDENT BANKSCiti Bank NA,
- Page 269 and 270:
267EXCHANGE COMPANIESHabib Qatar In
- Page 271 and 272:
269GLOSSARYCredit RatingsAn evaluat
- Page 273 and 274:
271GLOSSARYReturn on Average Assets
- Page 275:
273CORPORATE INFORMATIONCOMPLIANCE