

Indonesia Human Development Report 2001 - UNDP
Indonesia Human Development Report 2001 - UNDP
Indonesia Human Development Report 2001 - UNDP

You also want an ePaper? Increase the reach of your titles
YUMPU automatically turns print PDFs into web optimized ePapers that Google loves.
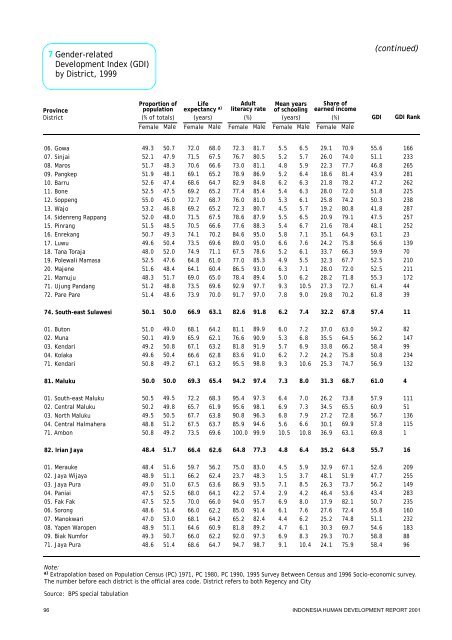
06.Gowa07.Sinjai08.Maros09.Pangkep10.Barru11.Bone12.Soppeng13.Wajo14.Sidenreng Rappang15.Pinrang16.Enrekang17.Luwu18.TanaToraja19.Polewali Mamasa20.Majene21.Mamuju71.UjungPandang72.Pare Pare01.Buton02.Muna03.Kendari04.Kolaka71.Kendari01.South-eastMaluku02.Central Maluku03.North Maluku04.Central Halmahera71.Ambon01.Merauke02.Jaya Wijaya03.Jaya Pura04.Paniai05.Fak Fak06.Sorong07.Manokwari08.Yapen Waropen09.Biak Numfor71.Jaya Pura74.South-east Sulawesi81.Maluku82.IrianJayaProvinceDistrictLifeexpectancy a)(years) (%) (%)Adultliteracyrate(years)Mean yearsofschoolingShare ofearnedincomeGDIGDI Rank72.071.570.669.168.669.272.769.271.570.574.173.574.964.864.169.073.573.968.165.967.166.667.172.265.767.767.573.559.766.267.568.070.066.068.164.666.068.666.969.366.449.352.151.751.952.652.555.053.252.051.550.749.648.052.551.648.351.251.451.050.149.249.650.850.550.249.548.850.848.448.949.047.547.548.647.048.949.348.650.150.048.468.067.566.665.264.765.268.765.267.566.670.269.671.161.060.465.069.670.064.262.163.262.863.268.361.963.863.769.656.262.463.664.166.062.264.260.962.264.763.165.462.650.747.948.348.147.447.545.046.848.048.549.350.452.047.648.451.748.848.649.049.950.850.449.249.549.850.551.249.251.651.151.052.552.551.453.051.150.751.450.050.051.772.376.773.078.982.977.476.072.378.677.684.689.067.577.086.578.492.991.781.176.681.883.695.595.495.690.885.9100.075.023.786.942.294.085.065.281.892.094.782.694.264.881.780.581.186.984.885.481.080.787.988.395.095.078.685.393.089.497.797.089.990.991.991.098.897.398.196.394.699.983.048.393.557.495.791.482.489.297.398.791.897.477.35.55.24.85.26.25.45.34.55.55.45.86.65.24.96.35.09.37.86.05.35.76.29.36.46.96.85.610.54.51.57.12.96.96.14.44.76.99.16.27.34.86.55.75.96.46.36.36.15.76.56.77.17.66.15.57.16.210.59.07.26.86.97.210.67.07.37.96.610.85.93.78.54.28.07.66.26.18.310.47.48.06.429.126.022.318.621.828.025.819.220.921.635.124.233.732.328.028.227.329.837.035.533.824.225.326.234.527.230.136.932.948.126.346.417.927.625.230.329.324.132.231.335.270.974.077.781.478.272.074.280.879.178.464.975.866.367.772.071.872.770.263.064.566.275.874.773.865.572.869.963.167.151.973.753.682.172.474.869.770.775.967.868.764.855.651.146.843.947.251.850.341.847.548.163.156.659.952.552.555.361.461.859.256.258.450.856.957.960.956.757.869.852.647.756.243.450.755.851.154.658.858.457.461.055.7166233265281262225238287257252231397021021117244398214799234132111511361151209255149283235160232183889611416Gender-related<strong>Development</strong>Index(GDI)byDistrict,19997Male Male Male MaleFemale Female Female FemaleProportion ofpopulation(% of totals)MaleFemale(continued)Note:Extrapolation based on Population Census(PC)1971, PC 1980,PC 1990,1995SurveyBetween Census and 1996 Socio-economicsurvey.The number before each districtisthe official area code.Districtrefers to both Regencyand Citya)Source: BPS special tabulationINDONESIAHUMAN DEVELOPMENT REPORT<strong>2001</strong>96


