

Indonesia Human Development Report 2001 - UNDP
Indonesia Human Development Report 2001 - UNDP
Indonesia Human Development Report 2001 - UNDP

Create successful ePaper yourself
Turn your PDF publications into a flip-book with our unique Google optimized e-Paper software.
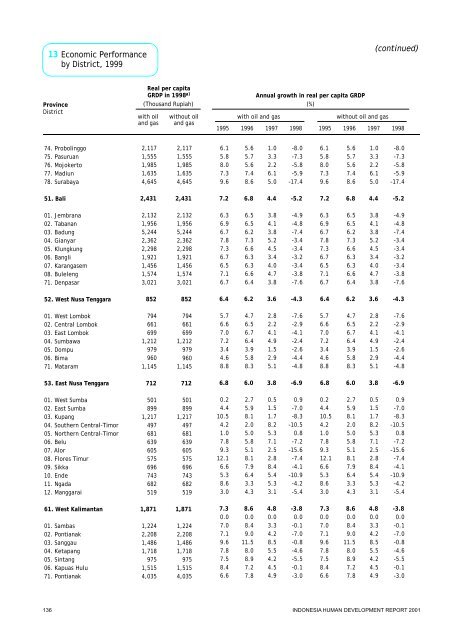
74.Probolinggo75.Pasuruan76.Mojokerto77.Madiun78.Surabaya01.Jembrana02.Tabanan03.Badung04.Gianyar05.Klungkung06.Bangli07.Karangasem08.Buleleng71.Denpasar01.WestLombok02.Central Lombok03.EastLombok04.Sumbawa05.Dompu06.Bima71.Mataram01.WestSumba02.EastSumba03.Kupang04.Southern Central-Timor05.Northern Central-Timor06.Belu07.Alor08.FloresTimur09.Sikka10.Ende11.Ngada12.Manggarai01.Sambas02.Pontianak03.Sanggau04.Ketapang05.Sintang06.Kapuas Hulu71.Pontianak51.Bali52.WestNusaTenggara53.East NusaTenggara61.WestKalimantan(continued)Real percapitaGRDPin 1998 a)Annual growth in real per capita GRDP(Thousand Rupiah) (%)6.15.88.07.39.66.36.96.77.87.36.76.57.16.75.76.67.07.23.44.68.80.24.410.54.21.07.89.312.16.65.38.63.00.07.07.19.67.87.58.46.67.26.46.87.35.65.75.67.48.66.56.56.27.36.66.36.36.66.44.76.56.76.43.95.88.32.75.98.12.05.05.85.18.17.96.43.34.30.08.49.011.58.08.97.27.86.86.26.08.61.03.32.26.15.03.84.13.85.24.53.44.04.73.82.82.24.14.91.52.95.10.51.51.78.25.37.12.52.88.45.45.33.10.03.34.28.55.54.24.54.94.43.63.84.8-8.0-7.3-5.8-5.9-17.4-4.9-4.8-7.4-3.4-3.4-3.2-3.4-3.8-7.6-7.6-2.9-4.1-2.4-2.6-4.4-4.80.9-7.0-8.3-10.50.8-7.2-15.6-7.4-4.1-10.9-4.2-5.40.0-0.1-7.0-0.8-4.6-5.5-0.1-3.0-5.2-4.3-6.9-3.8-8.0-7.3-5.8-5.9-17.4-4.9-4.8-7.4-3.4-3.4-3.2-3.4-3.8-7.6-7.6-2.9-4.1-2.4-2.6-4.4-4.80.9-7.0-8.3-10.50.8-7.2-15.6-7.4-4.1-10.9-4.2-5.40.0-0.1-7.0-0.8-4.6-5.5-0.1-3.0-5.2-4.3-6.9-3.81.03.32.26.15.03.84.13.85.24.53.44.04.73.82.82.24.14.91.52.95.10.51.51.78.25.37.12.52.88.45.45.33.10.03.34.28.55.54.24.54.94.43.63.84.85.65.75.67.48.66.56.56.27.36.66.36.36.66.44.76.56.76.43.95.88.32.75.98.12.05.05.85.18.17.96.43.34.30.08.49.011.58.08.97.27.86.86.26.08.66.15.88.07.39.66.36.96.77.87.36.76.57.16.75.76.67.07.23.44.68.80.24.410.54.21.07.89.312.16.65.38.63.00.07.07.19.67.87.58.46.67.26.46.87.32,1171,5551,9851,6354,6452,1321,9565,2442,3622,2981,9211,4561,5743,0217946616991,2129799601,1455018991,2174976816396055756967436825191,2242,2081,4861,7189751,5154,0352,4318527121,8712,1171,5551,9851,6354,6452,1321,9565,2442,3622,2981,9211,4561,5743,0217946616991,2129799601,1455018991,2174976816396055756967436825191,2242,2081,4861,7189751,5154,0352,4318527121,871with oiland gaswithoutoil andgaswith oilandgaswithoutoilandgas1995 19951996 19961997 19971998 1998ProvinceDistrictEconomicPerformancebyDistrict,199913INDONESIAHUMAN DEVELOPMENT REPORT<strong>2001</strong>136


