

Indonesia Human Development Report 2001 - UNDP
Indonesia Human Development Report 2001 - UNDP
Indonesia Human Development Report 2001 - UNDP

You also want an ePaper? Increase the reach of your titles
YUMPU automatically turns print PDFs into web optimized ePapers that Google loves.
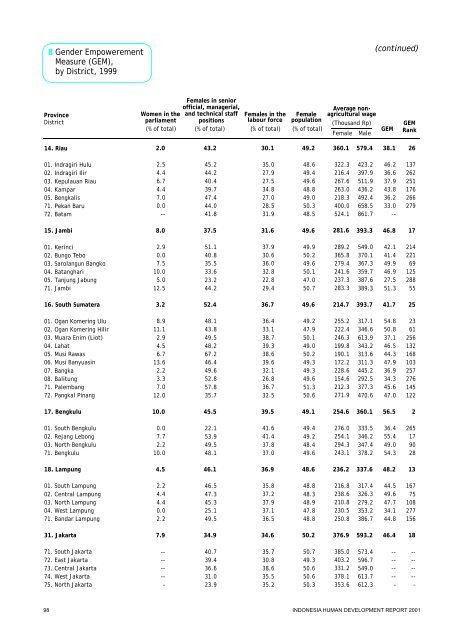
14.Riau15.Jambi16.South Sumatera17.Bengkulu18.Lampung31.Jakarta01.Indragiri Hulu02.Indragiri Ilir03.Kepulauan Riau04.Kampar05.Bengkalis71.Pekan Baru72.Batam01.Kerinci02.Bungo Tebo03.Sarolangun Bangko04.Batanghari05.Tanjung Jabung71.Jambi01.Ogan Komering Ulu02.Ogan Komering Hilir03.MuaraEnim(Liot)04.Lahat05.MusiRawas06.MusiBanyuasin07.Bangka08.Balitung71.Palembang72.Pangkal Pinang01.South Bengkulu02.Rejang Lebong03.North Bengkulu71.Bengkulu01.South Lampung02.Central Lampung03.North Lampung04.WestLampung71.Bandar Lampung71.South Jakarta72.EastJakarta73.Central Jakarta74.WestJakarta75.North Jakarta(continued)2.08.03.210.04.57.92.54.46.74.47.00.0--2.90.07.510.05.012.58.911.12.94.56.713.62.23.37.012.00.07.72.210.02.24.44.40.02.2--------–43.237.552.445.546.134.945.244.240.439.747.444.041.851.140.835.533.623.244.248.143.849.548.267.246.449.652.857.835.722.153.949.548.146.547.345.325.149.540.739.436.631.023.930.131.636.739.536.934.635.027.927.534.827.028.531.937.930.636.032.822.829.436.433.138.739.338.639.632.126.836.732.541.641.437.837.035.837.237.937.136.535.730.838.635.535.249.249.649.649.148.650.248.649.449.648.849.050.348.549.950.249.650.147.050.749.247.950.149.050.249.349.349.651.350.649.449.248.449.648.848.348.947.848.850.749.350.650.650.3360.1281.6214.7254.6236.2376.9322.3216.4267.6263.0218.3400.0524.1289.2365.8279.4241.6237.3283.3255.2222.4246.3199.8190.1172.2228.6154.6212.3271.9276.0254.1294.3243.1216.8238.6210.8230.5250.8385.0403.2331.2378.1353.6579.4393.3393.7360.1337.6593.2423.2397.9511.9436.2492.4658.5861.7549.0370.1367.3359.7387.6389.3317.1346.6613.9343.2313.6311.3445.2292.5377.3470.6333.5346.2347.4378.2317.4326.3279.2353.2386.7573.4596.7549.0613.7612.338.146.841.756.548.246.446.236.637.943.836.233.0--42.141.449.946.927.551.354.850.837.146.544.347.936.934.345.647.036.455.449.054.344.549.647.734.144.8--------–261725213181372622511762662792142216912528855236125613216810325727614512226517902816775108277156--------–Women intheparliament(% oftotal) GEMGEMRank(% oftotal)FemalepopulationProvinceDistrictGenderEmpowerementMeasure (GEM),byDistrict,19998(Thousand Rp)FemaleMaleAverage nonagriculturalwage(% oftotal)Femalesin seniorofficial,managerial,and technical staffpositions(% oftotal)Females in thelabourforceINDONESIAHUMAN DEVELOPMENT REPORT<strong>2001</strong>98


