

Indonesia Human Development Report 2001 - UNDP
Indonesia Human Development Report 2001 - UNDP
Indonesia Human Development Report 2001 - UNDP

Create successful ePaper yourself
Turn your PDF publications into a flip-book with our unique Google optimized e-Paper software.
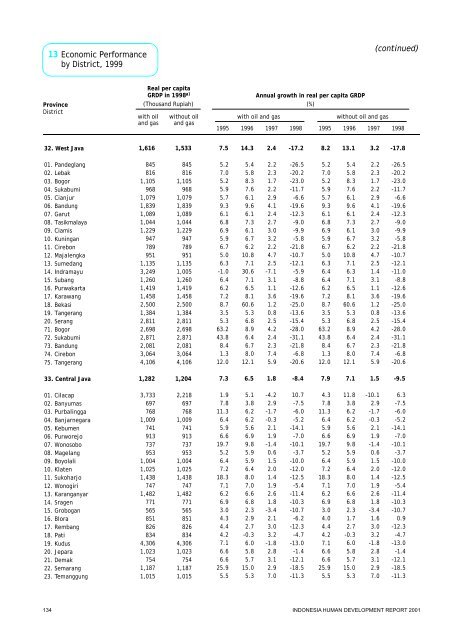
32.WestJava33.Central Java01.Pandeglang02.Lebak03.Bogor04.Sukabumi05.Cianjur06.Bandung07.Garut08.Tasikmalaya09.Ciamis10.Kuningan11.Cirebon12.Majalengka13.Sumedang14.Indramayu15.Subang16.Purwakarta17.Karawang18.Bekasi19.Tangerang20.Serang71.Bogor72.Sukabumi73.Bandung74.Cirebon75.Tangerang01.Cilacap02.Banyumas03.Purbalingga04.Banjarnegara05.Kebumen06.Purworejo07.Wonosobo08.Magelang09.Boyolali10.Klaten11.Sukoharjo12.Wonogiri13.Karanganyar14.Sragen15.Grobogan16.Blora17.Rembang18.Pati19.Kudus20.Jepara21.Demak22.Semarang23.Temanggung(continued)Real percapitaGRDPin 1998 a)Annual growth in real per capita GRDP(Thousand Rupiah) (%)8.27.95.27.05.25.95.79.36.16.86.95.96.75.06.36.46.46.27.28.73.55.363.243.88.41.312.04.37.811.36.45.96.619.75.26.47.218.37.16.26.93.04.04.44.27.16.66.625.95.513.17.15.45.88.37.66.19.66.17.36.16.76.210.87.16.37.16.58.160.65.36.88.96.46.78.012.111.83.86.26.25.66.99.85.95.96.48.07.06.66.82.31.72.7-0.36.05.85.715.05.33.21.52.22.31.72.22.94.12.42.73.03.22.24.72.51.43.11.13.61.20.82.54.22.42.37.45.9-10.12.9-1.7-0.32.11.9-1.40.61.52.01.41.92.61.8-3.41.63.03.2-1.82.83.12.97.0-17.8-9.5-26.5-20.2-23.0-11.7-6.6-19.6-12.3-9.0-9.9-5.8-21.8-10.7-12.1-11.0-8.8-12.6-19.6-25.0-13.6-15.4-28.0-31.1-21.8-6.8-20.66.3-7.5-6.0-5.2-14.1-7.0-10.1-3.7-10.0-12.0-12.5-5.4-11.4-10.3-10.70.9-12.3-4.7-13.0-1.4-12.1-18.5-11.3-17.2-8.4-26.5-20.2-23.0-11.7-6.6-19.6-12.3-9.0-9.9-5.8-21.8-10.7-12.1-5.9-8.8-12.6-19.6-25.0-13.6-15.4-28.0-31.1-21.8-6.8-20.610.7-7.5-6.0-5.2-14.1-7.0-10.1-3.7-10.0-12.0-12.5-5.4-11.4-10.3-10.7-6.2-12.3-4.7-13.0-1.4-12.1-18.5-11.32.41.82.22.31.72.22.94.12.42.73.03.22.24.72.5-7.13.11.13.61.20.82.54.22.42.37.45.9-4.22.9-1.7-0.32.11.9-1.40.61.52.01.41.92.61.8-3.42.13.03.2-1.82.83.12.97.014.36.55.45.88.37.66.19.66.17.36.16.76.210.87.130.67.16.58.160.65.36.88.96.46.78.012.15.13.86.26.25.66.99.85.95.96.48.07.06.66.82.32.92.7-0.36.05.85.715.05.37.57.35.27.05.25.95.79.36.16.86.95.96.75.06.3-1.06.46.27.28.73.55.363.243.88.41.312.01.97.811.36.45.96.619.75.26.47.218.37.16.26.93.04.34.44.27.16.66.625.95.51,5331,2048458161,1059681,0791,8391,0891,0441,2299477899511,1351,0051,2601,4191,4582,5001,3842,8112,6982,8712,0813,0644,1062,2186977681,0097419137379531,0041,0251,4387471,4827715658518268344,3061,0237541,1871,0151,6161,2828458161,1059681,0791,8391,0891,0441,2299477899511,1353,2491,2601,4191,4582,5001,3842,8112,6982,8712,0813,0644,1063,7336977681,0097419137379531,0041,0251,4387471,4827715658518268344,3061,0237541,1871,015with oiland gaswithoutoil andgaswith oilandgaswithoutoilandgas1995 19951996 19961997 19971998 1998ProvinceDistrictEconomicPerformancebyDistrict,199913INDONESIAHUMAN DEVELOPMENT REPORT<strong>2001</strong>134


