

Indonesia Human Development Report 2001 - UNDP
Indonesia Human Development Report 2001 - UNDP
Indonesia Human Development Report 2001 - UNDP

Create successful ePaper yourself
Turn your PDF publications into a flip-book with our unique Google optimized e-Paper software.
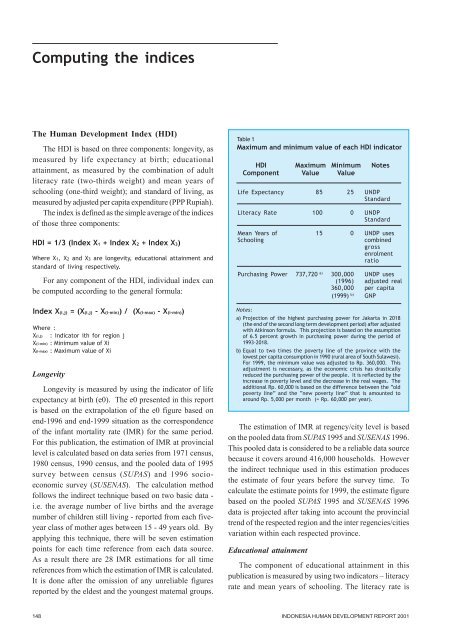
Computing the indicesThe <strong>Human</strong> <strong>Development</strong> Index (HDI)The HDI is based on three components: longevity, asmeasured by life expectancy at birth; educationalattainment, as measured by the combination of adultliteracy rate (two-thirds weight) and mean years ofschooling (one-third weight); and standard of living, asmeasured by adjusted per capita expenditure (PPP Rupiah).The index is defined as the simple average of the indicesof those three components:HDI = 1/3 (Index X1 + Index X2 + Index X3)Where X1, X2 and X3 are longevity, educational attainment andstandard of living respectively.For any component of the HDI, individual index canbe computed according to the general formula:Index X(i,j) = (X(i,j) - X(i-min)) / (X(i-max) - X(i-min))Where :X(i,j) : Indicator ith for region jX(i-min) : Minimum value of XiX(i-max) : Maximum value of XiLongevityLongevity is measured by using the indicator of lifeexpectancy at birth (e0). The e0 presented in this reportis based on the extrapolation of the e0 figure based onend-1996 and end-1999 situation as the correspondenceof the infant mortality rate (IMR) for the same period.For this publication, the estimation of IMR at provinciallevel is calculated based on data series from 1971 census,1980 census, 1990 census, and the pooled data of 1995survey between census (SUPAS) and 1996 socioeconomicsurvey (SUSENAS). The calculation methodfollows the indirect technique based on two basic data -i.e. the average number of live births and the averagenumber of children still living - reported from each fiveyearclass of mother ages between 15 - 49 years old. Byapplying this technique, there will be seven estimationpoints for each time reference from each data source.As a result there are 28 IMR estimations for all timereferences from which the estimation of IMR is calculated.It is done after the omission of any unreliable figuresreported by the eldest and the youngest maternal groups.Table 1Maximum and minimum value of each HDI indicatorHDI Maximum Minimum NotesComponent Value ValueLife Expectancy 85 25 <strong>UNDP</strong>StandardLiteracy Rate 100 0 <strong>UNDP</strong>StandardMean Years of 15 0 <strong>UNDP</strong> usesSchoolingcombinedgrossenrolmentratioPurchasing Power 737,720 a) 300,000 <strong>UNDP</strong> uses(1996) adjusted real360,000 per capita(1999) b) GNPNotes:a) Projection of the highest purchasing power for Jakarta in 2018(the end of the second long term development period) after adjustedwith Atkinson formula. This projection is based on the assumptionof 6.5 percent growth in purchasing power during the period of1993-2018.b) Equal to two times the poverty line of the province with thelowest per capita consumption in 1990 (rural area of South Sulawesi).For 1999, the minimum value was adjusted to Rp. 360,000. Thisadjustment is necessary, as the economic crisis has drasticallyreduced the purchasing power of the people. It is reflected by theincrease in poverty level and the decrease in the real wages. Theadditional Rp. 60,000 is based on the difference between the “oldpoverty line” and the “new poverty line” that is amounted toaround Rp. 5,000 per month (= Rp. 60,000 per year).The estimation of IMR at regency/city level is basedon the pooled data from SUPAS 1995 and SUSENAS 1996.This pooled data is considered to be a reliable data sourcebecause it covers around 416,000 households. Howeverthe indirect technique used in this estimation producesthe estimate of four years before the survey time. Tocalculate the estimate points for 1999, the estimate figurebased on the pooled SUPAS 1995 and SUSENAS 1996data is projected after taking into account the provincialtrend of the respected region and the inter regencies/citiesvariation within each respected province.Educational attainmentThe component of educational attainment in thispublication is measured by using two indicators – literacyrate and mean years of schooling. The literacy rate is148 INDONESIA HUMAN DEVELOPMENT REPORT <strong>2001</strong>


