

Indonesia Human Development Report 2001 - UNDP
Indonesia Human Development Report 2001 - UNDP
Indonesia Human Development Report 2001 - UNDP

Create successful ePaper yourself
Turn your PDF publications into a flip-book with our unique Google optimized e-Paper software.
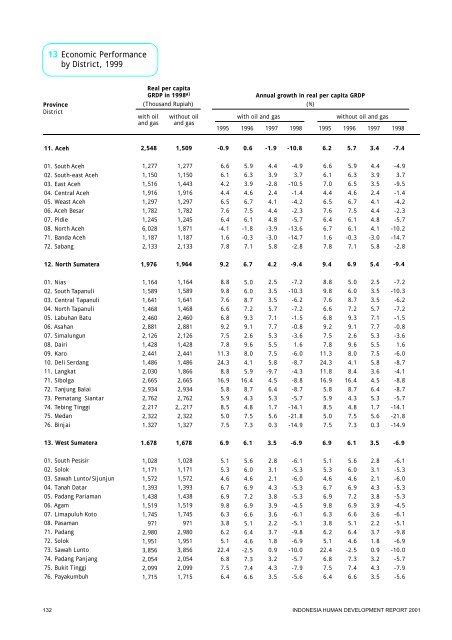
ProvinceDistrict11.Aceh12.North Sumatera13.WestSumatera01.SouthAceh02.South-eastAceh03.EastAceh04.CentralAceh05.WeastAceh06.Aceh Besar07.Pidie08.NorthAceh71.BandaAceh72.Sabang01.Nias02.SouthTapanuli03.Central Tapanuli04.NorthTapanuli05.Labuhan Batu06.Asahan07.Simalungun08.Dairi09.Karo10.DeliSerdang11.Langkat71.Sibolga72.Tanjung Balai73.Pematang Siantar74.TebingTinggi75.Medan76.Binjai01.South Pesisir02.Solok03.Sawah Lunto/Sijunjun04.Tanah Datar05.Padang Pariaman06.Agam07.Limapuluh Koto08.Pasaman71.Padang72.Solok73.Sawah Lunto74.Padang Panjang75.BukitTinggi76.PayakumbuhReal percapitaGRDPin 1998 a)Annual growth in real per capita GRDP(Thousand Rupiah) (%)6.29.46.96.66.17.04.46.57.66.46.71.67.88.89.87.66.66.89.27.57.811.324.311.816.95.85.98.55.07.55.15.34.66.76.99.86.33.86.25.122.46.87.56.45.76.96.15.96.36.54.66.77.56.16.1-0.37.15.06.08.77.29.39.12.69.68.04.18.416.48.74.34.87.57.35.66.04.66.97.26.96.65.16.44.6-2.57.37.46.63.45.43.54.43.93.52.44.14.44.84.1-3.05.82.53.53.55.77.17.75.35.57.55.83.64.56.45.31.75.60.32.83.12.14.33.83.93.62.23.71.80.93.24.33.5-7.4-9.4-6.9-4.93.7-9.5-1.4-4.2-2.3-5.7-10.2-14.7-2.8-7.2-10.3-6.2-7.2-1.5-0.8-3.61.6-6.0-8.7-4.1-8.8-8.7-5.7-14.1-21.8-14.9-6.1-5.3-6.0-5.3-5.3-4.5-6.1-5.1-9.8-6.9-10.0-5.7-7.9-5.6-10.8-9.4-6.9-4.93.7-10.5-1.4-4.2-2.3-5.7-13.6-14.7-2.8-7.2-10.3-6.2-7.2-1.5-0.8-3.61.6-6.0-8.7-4.3-8.8-8.7-5.7-14.1-21.8-14.9-6.1-5.3-6.0-5.3-5.3-4.5-6.1-5.1-9.8-6.9-10.0-5.7-7.9-5.6-1.94.23.54.43.9-2.82.44.14.44.8-3.9-3.05.82.53.53.55.77.17.75.35.57.55.8-9.74.56.45.31.75.60.32.83.12.14.33.83.93.62.23.71.80.93.24.33.50.66.76.15.96.33.94.66.77.56.1-1.8-0.37.15.06.08.77.29.39.12.69.68.04.15.916.48.74.34.87.57.35.66.04.66.97.26.96.65.16.44.6-2.57.37.46.6-0.99.26.96.66.14.24.46.57.66.4-4.11.67.88.89.87.66.66.89.27.57.811.324.38.816.95.85.98.55.07.55.15.34.66.76.99.86.33.86.25.122.46.87.56.4EconomicPerformancebyDistrict,199913with oiland gaswithoutoil andgaswith oilandgaswithoutoilandgas1995 19951996 19961997 19971998 19981,5091,9641,6781,2771,1501,4431,9161,2971,7821,2451,8711,1872,1331,1641,5891,6411,4682,4602,8812,1261,4282,4411,4861,8662,6652,9342,7622,.2172,3221,3271,0281,1711,5721,3931,4381,5191,7459712,9801,9513,8562,0542,0991,7152,5481,9761.6781,2771,1501,5161,9161,2971,7821,2456,0281,1872,1331,1641,5891,6411,4682,4602,8812,1261,4282,4411,4862,0302,6652,9342,7622,2172,3221.3271,0281,1711,5721,3931,4381,5191,7459712,9801,9513,8562,0542,0991,715INDONESIAHUMAN DEVELOPMENT REPORT<strong>2001</strong>132


