

Indonesia Human Development Report 2001 - UNDP
Indonesia Human Development Report 2001 - UNDP
Indonesia Human Development Report 2001 - UNDP

Create successful ePaper yourself
Turn your PDF publications into a flip-book with our unique Google optimized e-Paper software.
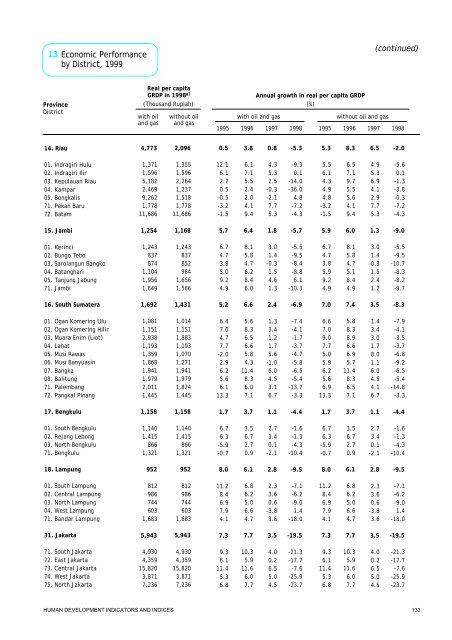
14.Riau15.Jambi16.South Sumatera17.Bengkulu18.Lampung31.Jakarta01.Indragiri Hulu02.Indragiri Ilir03.Kepulauan Riau04.Kampar05.Bengkalis71.Pekan Baru72.Batam01.Kerinci02.Bungo Tebo03.Sarolangun Bangko04.Batanghari05.Tanjung Jabung71.Jambi01.Ogan Komering Ulu02.Ogan Komering Hilir03.MuaraEnim(Liot)04.Lahat05.MusiRawas06.MusiBanyuasin07.Bangka08.Balitung71.Palembang72.Pangkal Pinang01.South Bengkulu02.Rejang Lebong03.North Bengkulu71.Bengkulu01.South Lampung02.Central Lampung03.North Lampung04.WestLampung71.Bandar Lampung71.South Jakarta72.EastJakarta73.Central Jakarta74.WestJakarta75.North Jakarta(continued)Real percapitaGRDPin 1998 a)Annual growth in real per capita GRDP(Thousand Rupiah) (%)5.35.97.01.78.07.35.56.14.34.94.8-3.2-1.56.74.73.85.99.24.96.67.09.07.75.05.96.25.66.913.36.76.3-5.9-0.711.28.46.97.94.19.36.111.45.36.88.36.07.43.76.17.76.57.19.75.55.64.19.48.15.84.75.18.44.95.88.38.96.66.95.711.48.36.57.13.56.72.70.96.86.25.06.64.710.35.911.66.07.76.51.33.51.12.83.54.95.36.94.12.97.75.33.01.4-0.31.52.41.21.43.43.01.78.01.16.04.54.16.72.73.40.1-2.12.33.60.6-3.83.64.00.26.55.04.5-2.0-9.0-8.3-4.4-9.5-19.5-5.60.1-1.3-3.8-0.3-7.2-4.3-5.5-9.5-10.7-8.3-8.2-9.7-7.9-4.1-3.5-3.7-6.8-9.2-6.5-5.4-14.8-3.3-1.6-1.3-4.3-10.4-7.1-6.2-9.01.4-18.0-21.3-17.7-7.6-25.9-23.7-5.3-5.7-6.9-4.4-9.5-19.5-9.30.1-14.0-36.04.8-7.2-4.3-5.5-9.5-8.4-8.86.1-10.3-7.4-4.1-1.7-3.7-4.7-5.8-6.5-5.4-13.7-3.3-1.6-1.3-4.3-10.4-7.1-6.2-9.01.4-18.0-21.3-17.7-7.6-25.9-23.70.81.82.41.12.83.54.35.32.5-0.3-2.17.75.33.01.4-0.31.54.61.31.33.41.21.75.6-1.06.04.53.16.72.73.40.1-2.12.33.60.6-3.83.64.00.26.55.04.53.86.46.63.76.17.76.17.15.52.42.04.19.48.15.84.76.28.46.05.68.36.56.65.84.311.48.36.07.13.56.72.70.96.86.25.06.64.710.35.911.66.07.70.55.75.21.78.07.312.16.12.70.5-0.5-3.2-1.56.74.73.85.09.24.96.47.04.77.7-2.02.96.25.66.113.36.76.3-5.9-0.711.28.46.97.94.19.36.111.45.36.82,0961,1681,4311,1589525,9431,3551,5962,2641,2371,5181,77811,6861,2438378529841,6561,5661,0141,1511,8831,1931,0701,2711,9411,9791,8241,4451,1401,4158661,3218129867446031,6834,9304,35915,8203,8717,2364,7731,2541,6921,1589525,9431,3711,5965,1822,4699,2621,77811,6861,2438378741,1041,9561,6491,0811,1512,9381,1931,3591,8681,9411,9792,0111,4451,1401,4158661,3218129867446031,6834,9304,35915,8203,8717,236with oiland gaswithoutoil andgaswith oilandgaswithoutoilandgas1995 19951996 19961997 19971998 1998ProvinceDistrictEconomicPerformancebyDistrict,199913HUMAN DEVELOPMENTINDICATORSAND INDICES 133


