

Indonesia Human Development Report 2001 - UNDP
Indonesia Human Development Report 2001 - UNDP
Indonesia Human Development Report 2001 - UNDP

You also want an ePaper? Increase the reach of your titles
YUMPU automatically turns print PDFs into web optimized ePapers that Google loves.
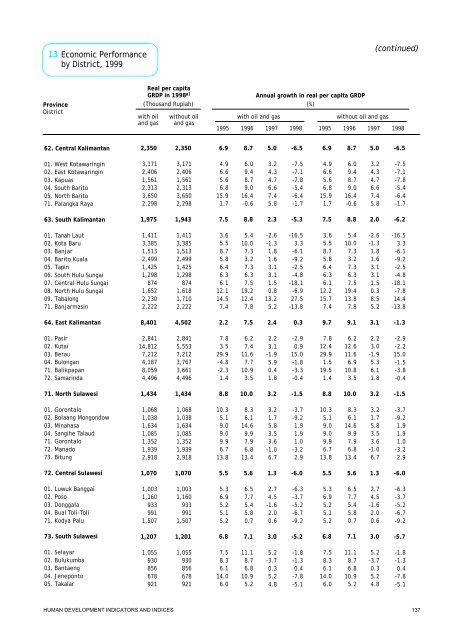
62.Central Kalimantan63.South Kalimantan64.East Kalimantan71.North Sulawesi72.Central Sulawesi73.South Sulawesi01.WestKotawaringin02.EastKotawaringin03.Kapuas04.South Barito05.North Barito71.PalangkaRaya01.Tanah Laut02.Kota Baru03.Banjar04.Barito Kuala05.Tapin06.South Hulu Sungai07.Central Hulu Sungai08.North Hulu Sungai09.Tabalong71.Banjarmasin01.Pasir02.Kutai03.Berau04.Bulongan71.Balikpapan72.Samarinda01.Gorontalo02.Bolaang Mongondow03.Minahasa04.Sangihe Talaud71.Gorontalo72.Manado73.Bitung01.Luwuk Banggai02.Poso03.Donggala04.BualToli-Toli71.Kodya Palu01.Selayar02.Bulukumba03.Bantaeng04.Jeneponto05.Takalar(continued)Real percapitaGRDPin 1998 a)Annual growth in real per capita GRDP(Thousand Rupiah) (%)6.97.59.78.85.56.84.96.65.66.815.91.73.65.58.75.86.46.36.112.215.77.47.812.429.91.519.51.410.35.19.09.09.96.713.85.36.95.25.15.27.58.36.114.06.08.78.89.110.05.67.16.09.48.79.016.4-0.65.410.07.33.27.36.37.519.413.87.86.212.611.66.910.83.58.36.114.69.97.96.813.46.57.75.45.80.711.18.76.810.95.25.02.03.13.21.33.03.24.34.76.67.45.8-2.6-1.31.81.63.13.11.50.38.55.22.23.0-1.95.36.11.83.21.75.83.53.6-1.06.72.74.5-1.62.00.65.2-3.70.35.24.8-6.5-6.2-1.3-1.5-6.0-5.7-7.5-7.1-7.8-5.4-6.4-1.7-16.53.3-6.1-9.2-2.5-4.8-18.1-7.814.4-13.8-2.9-2.215.0-1.5-3.8-0.4-3.7-9.21.91.91.0-3.22.9-6.3-3.7-5.2-6.7-9.2-1.8-1.30.4-7.8-5.1-6.5-5.30.3-1.5-6.0-5.2-7.5-7.1-7.8-5.4-6.4-1.7-16.53.3-6.1-9.2-2.5-4.8-18.1-6.927.5-13.8-2.90.915.0-1.8-3.3-0.4-3.7-9.21.91.91.0-3.22.9-6.3-3.7-5.2-6.7-9.2-1.8-1.30.4-7.8-5.15.02.32.43.21.33.03.24.34.76.67.45.8-2.6-1.31.81.63.13.11.50.813.25.22.23.1-1.95.90.41.83.21.75.83.53.6-1.06.72.74.5-1.62.00.65.2-3.70.35.24.88.78.87.510.05.67.16.09.48.79.016.4-0.65.410.07.33.27.36.37.519.212.47.86.27.411.67.710.93.58.36.114.69.97.96.813.46.57.75.45.80.711.18.76.810.95.26.97.52.28.85.56.84.96.65.66.815.91.73.65.58.75.86.46.36.112.114.57.47.83.529.9-4.8-2.31.410.35.19.09.09.96.713.85.36.95.25.15.27.58.36.114.06.02,3501,9434,5021,4341,0701,2013,1712,4061,5612,3133,6502,2981,4113,3851,5132,4991,4251,2988741,6181,7102,2222,8415,5537,2123,7673,6614,4961,0681,0381,6341,0851,3521,9392,9181,0031,1609339911,5071,0559308566789212,3501,9758,4011,4341,0701,2073,1712,4061,5612,3133,6502,2981,4113,3851,5132,4991,4251,2988741,6522,2302,2222,84114,8127,2124,1878,0594,4961,0681,0381,6341,0851,3521,9392,9181,0031,1609339911,5071,055930856678921with oiland gaswithoutoil andgaswith oilandgaswithoutoilandgas1995 19951996 19961997 19971998 1998ProvinceDistrictEconomicPerformancebyDistrict,199913HUMAN DEVELOPMENTINDICATORSAND INDICES 137


