

Indonesia Human Development Report 2001 - UNDP
Indonesia Human Development Report 2001 - UNDP
Indonesia Human Development Report 2001 - UNDP

Create successful ePaper yourself
Turn your PDF publications into a flip-book with our unique Google optimized e-Paper software.
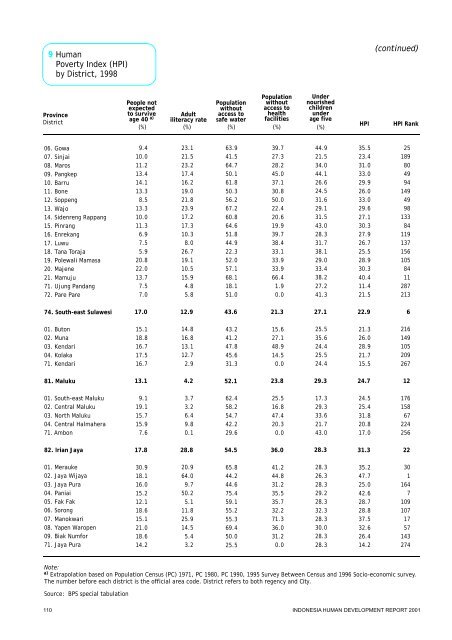
9 <strong>Human</strong>Poverty Index (HPI)byDistrict,1998(continued)ProvinceDistrictPeople notexpectedto surviveage 40 a)(%)Populationwithoutaccess tohealthUndernourishedchildrenunderAdultiliteracy rate(%)Populationwithoutaccess tosafe water(%)facilities(%)age five(%)HPIHPI Rank06.Gowa07.Sinjai08.Maros09.Pangkep10.Barru11.Bone12.Soppeng13.Wajo14.Sidenreng Rappang15.Pinrang16.Enrekang17.Luwu18.TanaToraja19.Polewali Mamasa20.Majene21.Mamuju71.UjungPandang72.Pare Pare9.410.011.213.414.113.38.513.310.011.36.97.55.920.822.013.77.57.023.121.523.217.416.219.021.823.917.217.310.38.026.719.110.515.94.85.863.941.564.750.161.850.356.267.260.864.651.844.922.352.057.168.118.151.039.727.328.245.037.130.850.022.420.619.939.738.433.133.933.966.41.90.044.921.534.044.126.624.531.629.131.543.028.331.738.129.033.438.227.241.335.523.431.033.029.926.033.029.627.130.327.926.725.528.930.340.411.421.525189804994149499813384119137156105841128721374.South-east Sulawesi17.012.943.621.327.122.9601.Buton02.Muna03.Kendari04.Kolaka71.Kendari15.118.816.717.516.714.816.813.112.72.943.241.247.845.631.315.627.148.914.50.025.535.624.425.524.421.326.028.921.715.521614910520926781.Maluku13.14.252.123.829.324.71201.South-eastMaluku02.Central Maluku03.North Maluku04.Central Halmahera71.Ambon9.119.115.715.97.63.73.26.49.80.162.458.254.742.229.625.516.847.420.30.017.329.333.621.743.024.525.431.820.817.01761586722425682.IrianJaya17.828.854.536.028.331.32201.Merauke02.Jaya Wijaya03.Jaya Pura04.Paniai05.Fak Fak06.Sorong07.Manokwari08.Yapen Waropen09.Biak Numfor71.Jaya Pura30.918.116.015.212.118.615.121.018.614.220.964.09.750.25.111.825.914.55.43.265.844.244.675.459.155.255.369.450.025.541.244.831.235.535.732.271.336.031.20.028.326.328.329.228.332.328.330.028.328.335.247.725.042.628.728.837.532.626.414.230116471091071757143274Note:a) Extrapolation based on Population Census(PC)1971, PC 1980,PC 1990,1995SurveyBetween Census and 1996 Socio-economicsurvey.The number before each districtisthe official area code.Districtrefers to both regencyand City.Source: BPS special tabulation110INDONESIAHUMAN DEVELOPMENT REPORT<strong>2001</strong>


