

Indonesia Human Development Report 2001 - UNDP
Indonesia Human Development Report 2001 - UNDP
Indonesia Human Development Report 2001 - UNDP

Create successful ePaper yourself
Turn your PDF publications into a flip-book with our unique Google optimized e-Paper software.
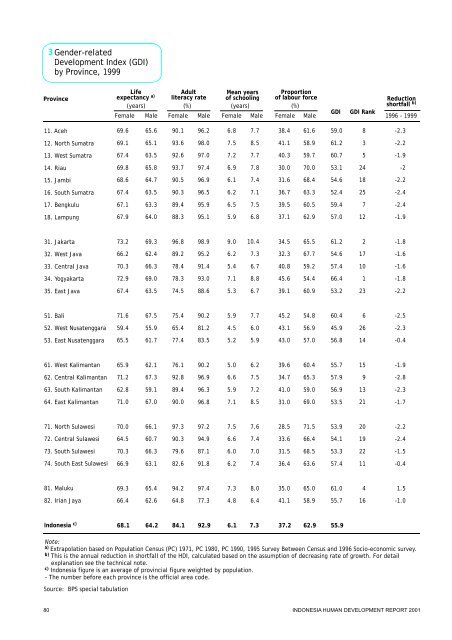
3 Gender-related<strong>Development</strong>Index(GDI)byProvince, 1999ProvinceLifeexpectancy a)Female(years)MaleAdultliteracyrate(%)Mean yearsofschooling(years)Proportionoflabour force(%)Female Male Female Male Female MaleGDIGDI RankReductionshortfall b)1996 -199911.Aceh69.665.690.196.26.87.738.461.659.08-2.312.North Sumatra69.165.193.698.07.58.541.158.961.23-2.213.WestSumatra67.463.592.697.07.27.740.359.760.75-1.914.Riau69.865.893.797.46.97.830.070.053.124-215.Jambi68.664.790.596.96.17.431.668.454.618-2.216.South Sumatra67.463.590.396.56.27.136.763.352.425-2.417.Bengkulu67.163.389.495.96.57.539.560.559.47-2.418.Lampung67.964.088.395.15.96.837.162.957.012-1.931.Jakarta73.269.396.898.99.010.434.565.561.22-1.832.WestJava66.262.489.295.26.27.332.367.754.617-1.633.Central Java70.366.378.491.45.46.740.859.257.410-1.634.Yogyakarta72.969.078.393.07.18.845.654.466.41-1.835.EastJava67.463.574.588.65.36.739.160.953.223-2.251.Bali71.667.575.490.25.97.745.254.860.46-2.552.WestNusatenggara59.455.965.481.24.56.043.156.945.926-2.353.EastNusatenggara65.561.777.483.55.25.943.057.056.814-0.461.WestKalimantan65.962.176.190.25.06.239.660.455.715-1.962.Central Kalimantan71.267.392.896.96.67.534.765.357.99-2.863.South Kalimantan62.859.189.496.35.97.241.059.056.913-2.364.EastKalimantan71.067.090.096.87.18.531.069.053.521-1.771.North Sulawesi70.066.197.397.27.57.628.571.553.920-2.272.Central Sulawesi64.560.790.394.96.67.433.666.454.119-2.473.South Sulawesi70.366.379.687.16.07.031.568.553.322-1.574.South EastSulawesi66.963.182.691.86.27.436.463.657.411-0.481.Maluku69.365.494.297.47.38.035.065.061.041.582.Irian Jaya66.462.664.877.34.86.441.158.955.716-1.0<strong>Indonesia</strong> c)68.164.284.192.96.17.337.262.955.9Note:a) Extrapolation basedon Population Census (PC)1971,PC 1980,PC 1990, 1995 Survey Between Censusand1996Socio-economic survey.b) This is the annual reduction in shortfall of the HDI,calculated basedon the assumption ofdecreasing rate ofgrowth. For detailexplanation see the technicalnote.c) <strong>Indonesia</strong> figure is an average ofprovincial figure weighted by population.-The number before each province isthe official areacode.Source: BPS special tabulation80INDONESIAHUMAN DEVELOPMENT REPORT<strong>2001</strong>


